How TypeSafe achieved 46% higher GPU throughput training Jev - with the help of Zymtrace
TypeSafe trains and serves Jev, a System One Model that returns structured decisions in milliseconds. Using Zymtrace continuous GPU profiling and profile-guided agentic optimization, the team made incremental training optimizations that compounded into 46% higher GPU throughput, alongside an ~10% performance gain in inference.


Israel Ogbole
While training Jev, TypeSafe needed to understand where execution time was going across CPU code, GPU kernels, and communication. That visibility also needed to fit the team’s development workflow, where engineers and AI coding agents investigate bottlenecks, propose changes, and run experiments.
Zymtrace became the optimization layer for that workflow, connecting continuous profiling with profile-guided agentic optimization. It helped the team pinpoint bottlenecks, guide experiments, and validate their impact. As each optimization changed the workload, always-on profiling revealed the next constraint. The result was a sequence of targeted optimizations spanning compute, memory, and communication.
We’ve been building Jev for a long time. We use Zymtrace for both training and inference. It’s a significant step up from any of the competition and we view it as the best profiler on the market. It is our go-to tool for profiling training and inference and is also great for monitoring.
— Erik Gafni, CTO, TypeSafe
The Jevolution
For years, large generalist models were the Swiss Army knives of AI, expected to handle every task. TypeSafe built Jev as a precision tool. It takes unstructured input and typed questions and returns probabilistic decisions in a single parallel pass, up to 193.6× faster and at 1/444.6 the cost of LLMS in TypeSafe’s benchmarks. Jev’s launch sent a wave through the industry; it changed how teams think about AI - less chat, more automation.
Training a revolutionary model like Jev takes serious performance discipline. During training, keeping intermediate outputs consumes GPU memory, while discarding and recomputing them consumes time. Compute-heavy operations can introduce expensive intermediate work. Communication becomes more significant as compute gets faster.
TypeSafe moves fast, and every optimization changes how those trade-offs play out. Each improvement reveals where the next gain is. Keeping that pace meant seeing exactly what the training run was doing at any moment, without stopping to set up a profiling session each time, and putting that data in the hands of agents that could find and act on the next optimization. TypeSafe needed a GPU performance optimization solution that kept up with how they work, so they turned to Zymtrace.
The challenge: Cluster-wide GPU visibility
TypeSafe’s questions were specific. Which operations were producing expensive intermediate work? Which tensors were worth keeping in GPU memory, and which were cheaper to discard and recompute? How did the balance between compute and communication shift after each optimization?
Every perf gain shifted the balance and revealed the next one, and the gains compounded. The only reliable answers came from the live training run, measured cluster-wide.
PyTorch Profiler and NVIDIA Nsight weren’t built for that. PyTorch Profiler requires code changes, with profiling wrapped around the training loop by hand. Nsight caps captures at five minutes and adds 40 to 400× overhead, so what you measure is no longer the job you’re running. Either way, getting an answer meant changing code or restarting the job, and paying a heavy performance tax. For a team that iterates as fast as TypeSafe, that friction meant the answers arrived after they had already moved on.
What TypeSafe needed was simple to state and hard to build:
- Always on. Attached to live processes cluster-wide, light enough to leave running for the whole training run, with zero application code changes.
- Self-hosted. Continuous profiling and GPU topology health monitoring in one platform, on their own infrastructure.
- Full-stack. Fully symbolized from CPython frames through native code and the CUDA runtime down to individual GPU instructions and their stall reasons, so any slowdown traces back to the line of Python that caused it.
- Agent-ready. Exposed to agents through MCP, so the optimization loop could run without a human pulling every profile.
Zymtrace deployment and operation have been as smooth as possible for us! We were able to run it across our training and inference clusters without changing a single line of application code. Huge shoutout to the Zymtrace team, who were very eager to help, quick to respond, and had our back throughout the whole process!
— Daniel Gafni, TypeSafe
The solution: Continuous profiling and profile-guided agentic optimization
Zymtrace is the optimization layer for heterogeneous compute: continuous, zero-instrumentation profiling for CPU and GPU workloads, with monitoring and GPU topology health in the same platform. Profiles connect CPU call paths to GPU execution, down to individual instructions and stall reasons, so teams can see exactly why a kernel underperforms and maximize throughput per GPU, per dollar, per watt.
TypeSafe used that execution data for profile-guided agentic optimization. Its AI coding agents could examine profiles, propose hypotheses, estimate potential improvements, and run short experiments. Subsequent profiles helped assess each change and identify what to investigate next.
Dmitry Norkin described the workflow:
What made Zymtrace especially useful for us was that profiling could be nearly always on without being intrusive, and the data was easily accessible through MCP. That let us put agents into a tight optimization loop: inspect the compute/communication balance, form hypotheses, estimate the payoff of potential changes, run short experiments, profile the results, and then repeat with the new information.
— Dmitry Norkin, TypeSafe
Zymtrace continuously profiles the workload. TypeSafe’s engineers and AI coding agents use the resulting data to guide optimization. Each experiment produces new evidence about whether a change helped and where execution time is now being spent.
The results: 46% higher training throughput and approximately 10% better inference performance
Win story 1: Three successive improvements to Jev training
TypeSafe’s training gains came from a sequence of targeted changes. Each improvement changed the workload’s performance balance and informed the next investigation.
What the team found
The first investigation, guided by zymtrace’s deep introspection, identified expensive intermediate work in a compute-heavy operation on the training path. The second rebalanced the memory-versus-recompute trade-off for intermediate states, informed by what the profiles showed was actually worth keeping. As compute became more efficient, communication emerged as the limiting factor, and the third optimization restructured the workload to get more out of each communication step.
Impact
TypeSafe reported that the three optimizations, applied sequentially, compounded to approximately 46% higher training throughput on the same hardware.
Dmitry explained the progression:
We made several performance optimizations back to back using Zymtrace feedback. Each round, the profiles showed us where the time was actually going - we removed intermediate work we didn’t need, rebalanced what we keep in memory versus what we recompute, and once compute got faster and comms became the bottleneck, restructured the workload to get more out of each communication step. Together that compounded to roughly 46% higher training throughput
— Dmitry Norkin, TypeSafe
Continuous profiling supported the full sequence. After each change, the team could revisit the execution data and see where the next optimization opportunity had emerged.
Win story 2: Finding a hidden synchronization in inference
Inference performance is critical for TypeSafe, and every millisecond spent outside kernel execution is a cost the team actively hunts down.
Using Zymtrace, the team found a hidden device-to-host synchronization buried in kernel metadata preparation. The GPU was stalling while the CPU waited on a copy back from the device before the next launch. Fixing it delivered a 10% improvement in inference performance.
This is the kind of bottleneck that falls between tools. A GPU profiler shows the gap between kernels but not which host code caused it. A CPU profiler shows a thread blocked in the CUDA runtime but not what it was waiting for on the device. Zymtrace connects the two: every GPU kernel is linked to the exact CPU stack that launched it, from the application code through native libraries and the CUDA runtime down to the Linux kernel, in a single trace.
Every frame in that stack is symbolized automatically. No debug builds, no manual symbol uploads, no instrumentation, no code changes. Zymtrace uses eBPF to unwind stacks across interpreted and native code without touching the runtime, so the team was looking at real function names from the first deploy.
Zymtrace offers excellent always-on profiling. We’ve relied on it for host and device execution diagnosis and kernel optimization, which helped us realize up to a 10% speedup. Setup is straightforward, and the experience is seamless. A must-have for any optimization toolkit.
— Carl You, TypeSafe
Why TypeSafe chose Zymtrace
TypeSafe needed detailed execution visibility without adding substantial overhead or maintenance work to its training and inference environments. Its requirements covered continuous profiling, performance monitoring, and GPU topology health, with the resulting execution data available for profile-guided agentic optimization.
1. Always-on profiling from CPU code to GPU instructions
Zymtrace provides non-intrusive, continuous CPU and GPU profiling with extremely low overhead and no application code changes. Symbolized CPU stack traces connect application code to GPU kernel launches, while GPU instruction samples and stall reasons help engineers investigate expensive kernel behavior.
For TypeSafe, execution data remained available as the team worked through successive optimizations. Engineers could investigate a finding, test a change, and return to fresh profiles without rebuilding the profiling workflow for each experiment.
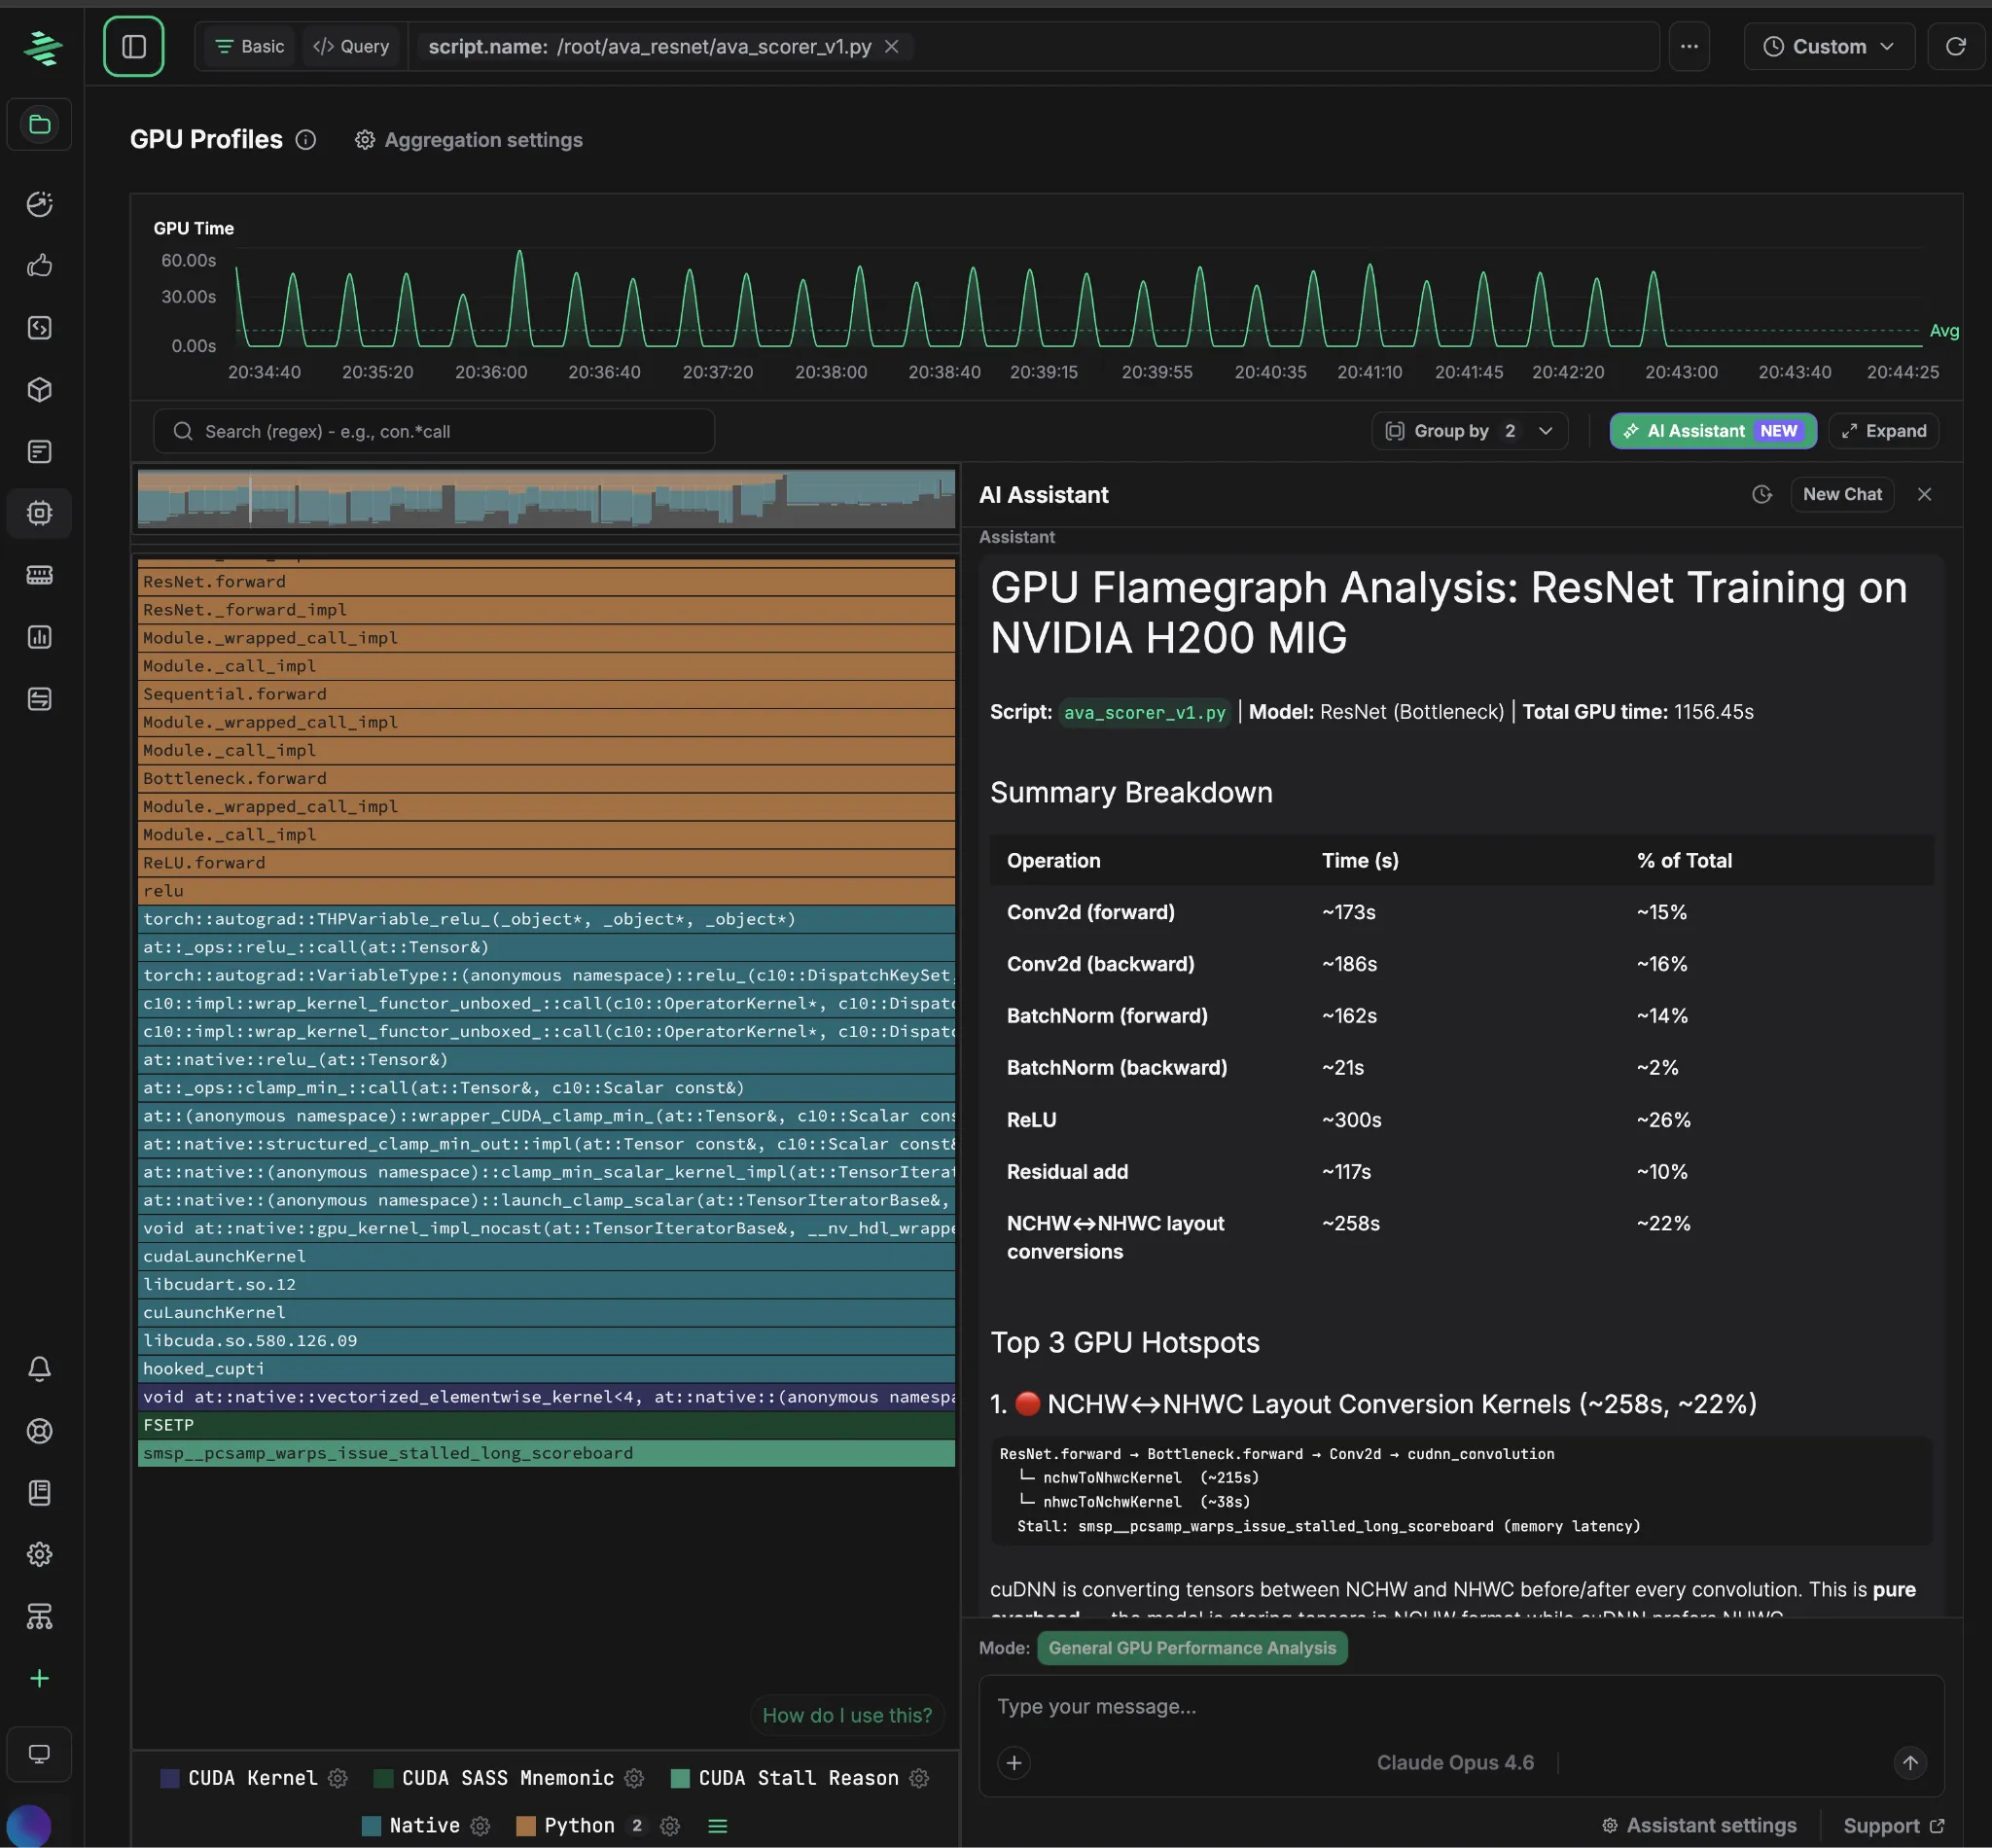
Note: This is not a TypeSafe workload.
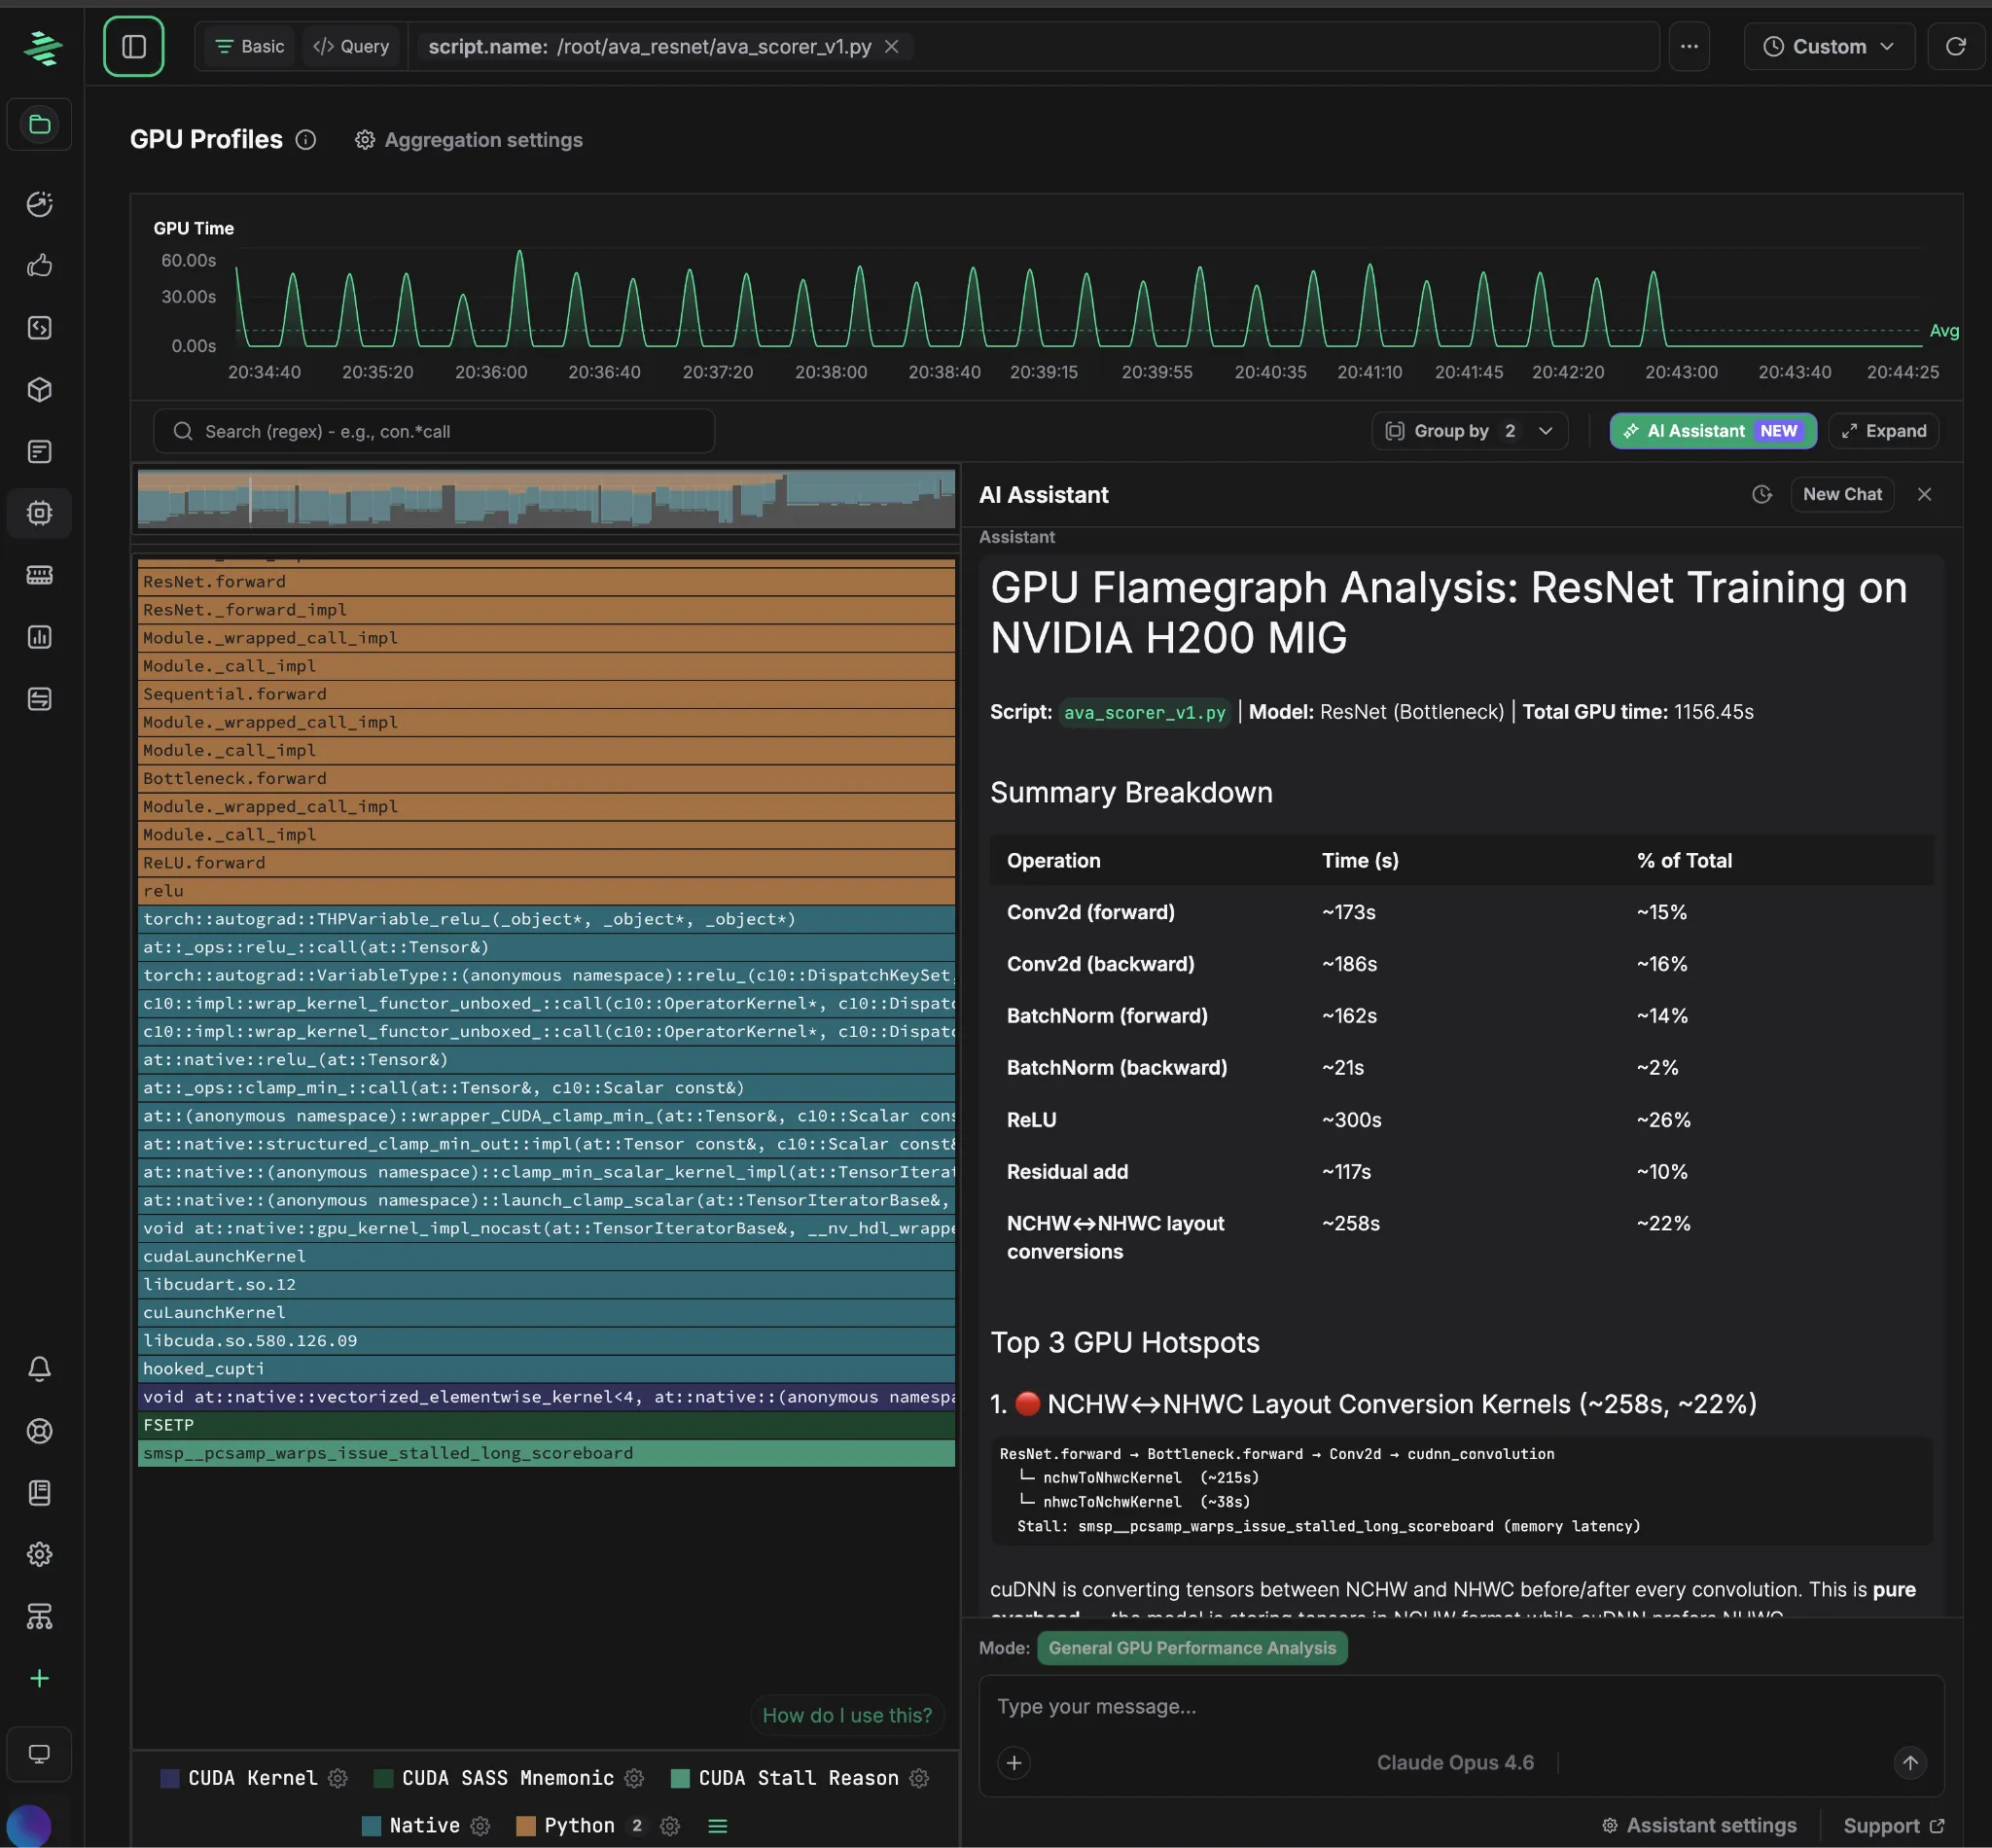
2. Profile-guided agentic optimization
TypeSafe’s AI coding agents used execution profiles to investigate concrete performance questions and propose targeted experiments.
This kept the optimization process connected to the workload’s measured behavior.
Profiles supplied the evidence for a hypothesis. Experiments measured its effect. The team then used the results to decide what to investigate next.
3. Monitoring and GPU topology health alongside profiles
Zymtrace brings host, GPU, and inference-engine metrics together with execution profiles. Engineers can investigate a throughput change or utilization drop by examining the relevant workload and time period.
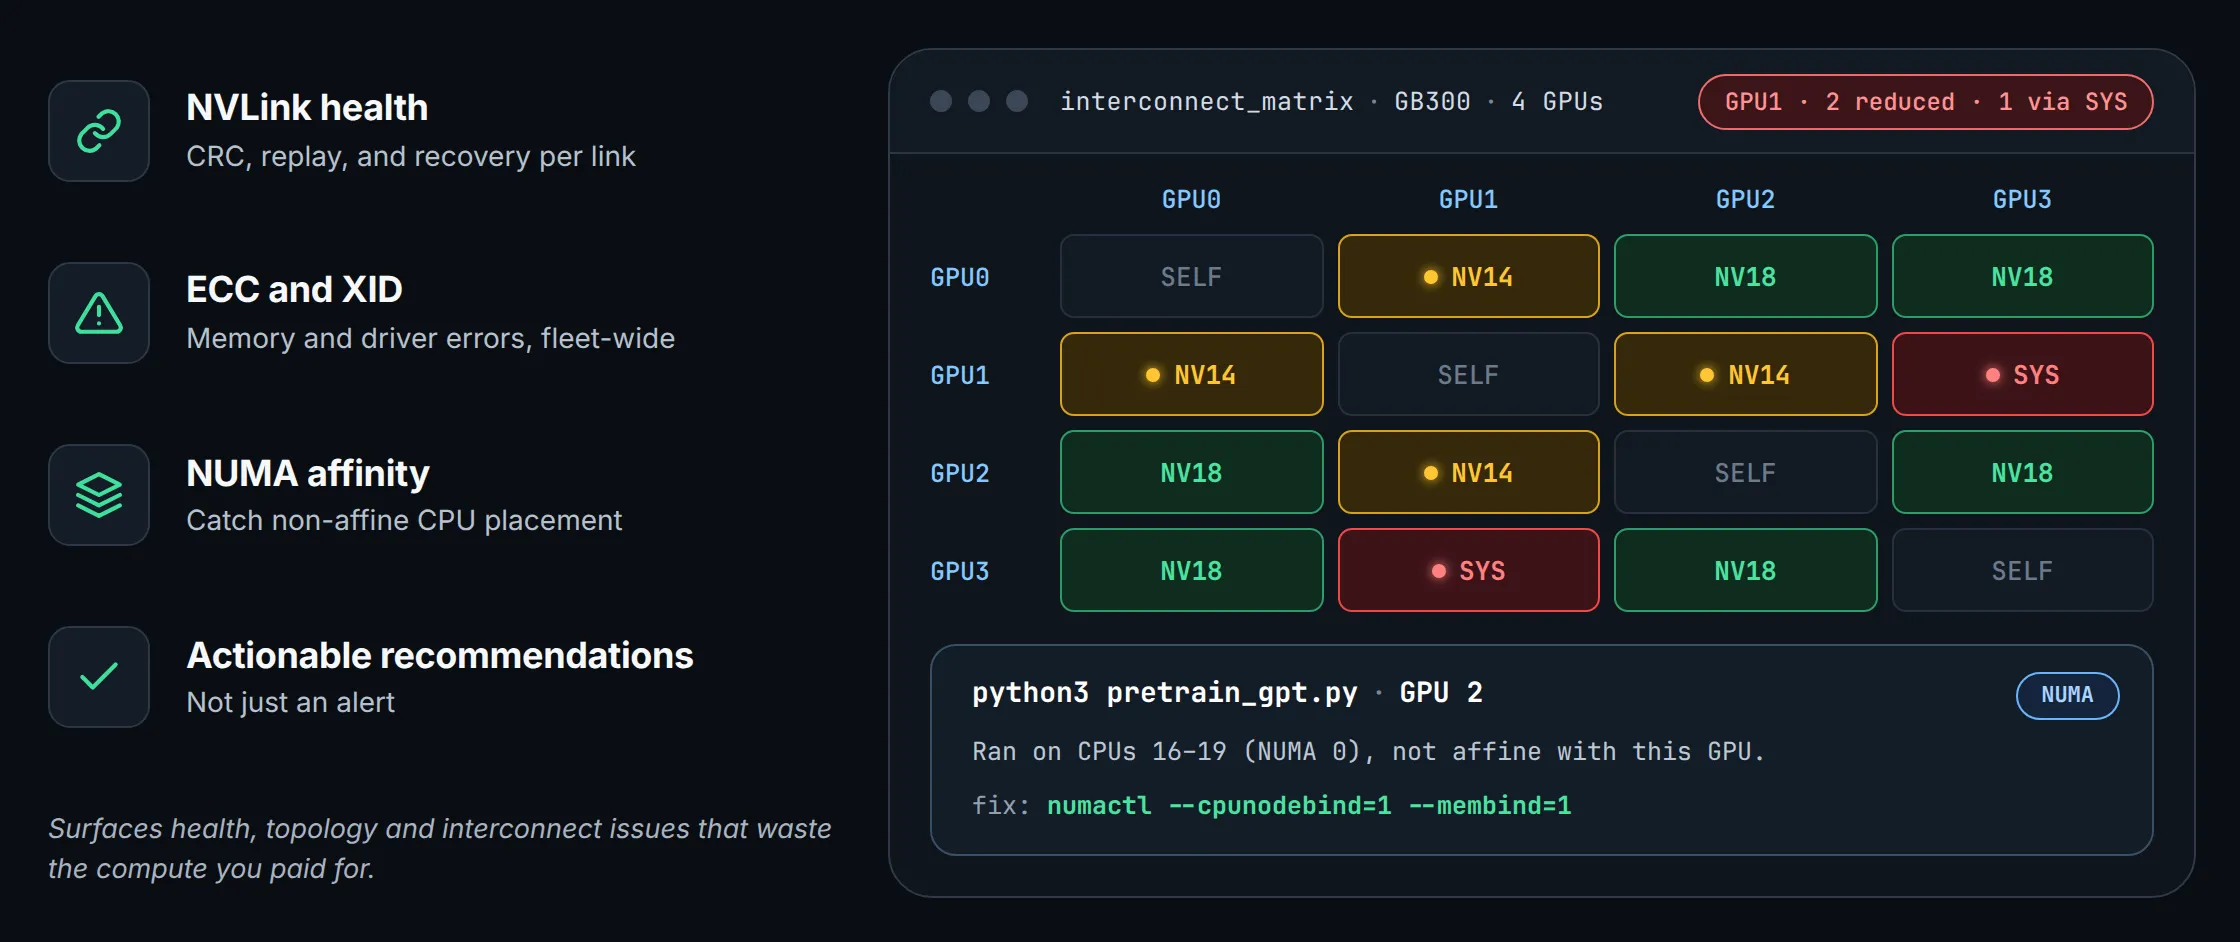
GPU topology health adds visibility into GPU connectivity and hardware health, including NVLink, XID events, and ECC errors. These signals provide additional context when investigating whether performance changes involve application execution, communication, or hardware conditions.
Having profiling, monitoring, and topology health in one platform gives teams a common starting point for investigating performance across those layers.
See it in action
If you are optimizing GPU training or inference workloads, Zymtrace gives engineers and AI coding agents the execution data to investigate bottlenecks, test targeted changes, and measure their impact.


