Introducing Zymtrace GPU Straggler Detector
Zymtrace's profile-aware straggler detection finds the slowest GPU from collective communication and correlates it with the userspace code and CUDA kernels behind it. On one 8× H100 node, that led to a 1.42× faster FSDP job.


Israel Ogbole

Abdullah Eryüzlü
A distributed or multi-GPU workload runs at the speed of its slowest GPU. GPUs sync many times per step, and each sync waits for the slowest GPU. One late GPU stalls all the others without raising an error. Zymtrace GPU Straggler Detector finds the late GPU with our proprietary detection algorithm, built on the communication data Zymtrace collects from every GPU. Detection is profile-aware, so each straggler is automatically correlated with the CPU and CUDA profiles of the same window, from the code that issued the collective down to the GPU kernel.
Below, we walk through two use cases on a single 8× H100 node, because a straggler can come from the code or from the hardware, and each needs a different fix. The first recreates a software straggler from ByteDance’s OSDI ‘25 study, where an imbalanced data split overloads one GPU. The second throttles one GPU’s clock to simulate a thermally throttled GPU. Zymtrace flags the late GPU in both, and the profiles and hardware checks show which fix each one needs.
One slow GPU can stall the whole job
Distributed GPU workloads exchange data through collectives, e.g. AllReduce in DDP and tensor-parallel inference, and AllGather and ReduceScatter in FSDP. Each GPU is driven by one process, called a rank, and a collective completes only when every rank in its group, the communicator, has joined. If one rank arrives 1.5 ms late, the others spend about 1.5 ms spinning inside the collective kernel. With per-block sharding, FSDP synchronizes at every transformer block, so the wait repeats throughout each training step.
Stragglers fail quietly. The job keeps running while step time creeps up and throughput regresses. The cause can sit anywhere in the stack, e.g. a throttled GPU, ECC or NVLink errors, a NIC problem, uneven data shards, or a slow data loader. Every node can pass its health checks while one rank holds back the whole job.
The usual tools struggle to see them:
- Nothing fails. There’s no exception, and the late rank arrives well within the collective’s timeout.
- Utilization stays high. A GPU spinning in a collective kernel counts as busy.
- The late GPU looks fastest. It arrives last and barely waits, so it spends the least time in collectives, and a dashboard ranking GPUs by that time puts it at the bottom.
Stragglers are costly, and most start in the code
The best public data on how much GPU time stragglers waste comes from ByteDance. Lin et al. analyzed 3,079 jobs that used at least 128 GPUs, from five months of traces on ByteDance’s LLM training cluster [1]. They used what-if analysis, replaying each job’s profiled operations in a simulator with the stragglers removed and comparing the result with what actually ran.
| Finding | Value |
|---|---|
| Traced jobs slowed by stragglers (at least 10% slower) | 42.5% |
| Allocated GPU hours wasted to stragglers, across all jobs | 10.4% |
| Jobs that wasted at least 21.3% of their GPU hours | more than 10% |
| Jobs that wasted at least 45% of their GPU hours | about 1% |
In ByteDance’s cluster, close to half of large training jobs ran at least 10% slower than they should have, and nothing alerted anyone, because nothing failed. The rate differs from cluster to cluster, but one late rank makes every other GPU in the job wait, so the cost grows with the size of the job.
Faulty machines were a minor cause. The common causes sat in the workload:
- Pipeline stage imbalance. The last stage also runs the loss layer, so splitting layers evenly across stages overloads it. It explained most of the slowdown in 39.3% of straggling jobs.
- Sequence-length imbalance. Attention cost grows with the square of sequence length, so micro-batches with the same token budget can take very different times. It affected 21.4% of straggling jobs, more so in long-context training.
- Python garbage collection. A stop-the-world collection pauses one rank for hundreds of milliseconds, and ranks collect at different times, so the job stalls repeatedly.
The authors conclude that traditional health metrics are unlikely to help detect or prevent most stragglers. Draining the node fixes a broken GPU. When the data split is the cause, the straggler just moves to another rank, and finding the cause takes profiles of every rank from the time it appeared. ByteDance found these causes by profiling every training job in production [1]. Zymtrace profiles every host continuously for the same reason, and its GPU Straggler Detector automatically correlates every late rank it finds with the profiles that show why.
How Zymtrace straggler detection works
Zymtrace introspects GPU-to-GPU communication inside every rank’s process. For each collective, communicator, and message-size bucket, it records execution time, message size, and bandwidth, plus per-rank counts and sequence numbers. It needs NCCL 2.27 or newer and no changes to your code. The full metric list is in the Metrics Reference.
From that data, our detection algorithm finds stragglers in four steps:
- Per communicator. Each communicator is evaluated on its own, so tensor- and data-parallel groups are judged separately. Communicators of three or more ranks are checked.
- Lag. The late rank waits the least, so its mean collective time is the lowest in the communicator. Subtracted from the median of its peers’, it gives how long the peers waited for it per collective, which the UI reports as lag per exchange, and the waiting share, the fraction of the peers’ collective time spent waiting for it.
- Persistence. A rank has to be late repeatedly, which filters out one-off hiccups. Each stretch of lateness is an episode.
- Origin. If the late GPU was itself waiting in another communicator at the time, the episode is marked as propagated, so the investigation starts where the stall began.
Detection runs on that communication data. To find a likely cause, Zymtrace then checks the GPU metrics it collects from the communicator’s GPUs over the same episode. It flags clocks throttled by power or thermal limits, a busy SM clock at least 10% below the same model’s peers in the communicator, and NVLink errors above the link’s rate in the six hours before, on links the communicator could have used. The communication data doesn’t show which NVLink lanes or NICs a collective used, so an NVLink error is a possible path rather than a proven one. NIC and InfiniBand problems aren’t covered.
A second detector handles the opposite case, where every rank of a communicator slows down at once and no single rank is late. It compares each rank’s algorithmic bandwidth for one collective, in one message-size bucket, on one communicator, with that rank’s own median over the previous 24 hours. The operation is scored by its least-slowed rank, so it’s flagged only when every rank’s bandwidth drops, and the waiting peers of a straggler can’t trigger it on their own. The default threshold is a 30% bandwidth drop, which means up to 1.43× the time. A rank needs 10 minutes of history before it can be flagged, and periods where the mean message size shifted by more than 25% aren’t compared.
How often that happens depends on the cluster. FALCON, a study of a shared cluster of over 10,000 GPUs on RoCE, found slow communication in 43 of 107 four-node probe jobs, mostly from network congestion, lasting 24 minutes on average [2]. ByteDance’s dedicated clusters, with an overprovisioned network, saw mostly slow computation instead. The slow-operation detector flags the resulting bandwidth drop whatever its cause, although the possible-causes check doesn’t diagnose network faults.
Both detectors cover collectives. Point-to-point Send and Recv, which pipeline parallelism uses between stages, aren’t checked.
On SLURM clusters that use cgroup/v2 process tracking, Zymtrace ties every communicator to the SLURM job ID of its processes, so a straggler maps to the job that owns it. The same job ID filters CPU and GPU profiles and metrics across Zymtrace, so you can scope the drill-down to one job on a shared node (SLURM-aware GPU profiling).
Every straggler is correlated with its profiles
Every straggler and slow operation is automatically correlated with the CUDA flamegraph and the CPU flamegraph for the same window. The profiler has been recording the job all along. It unwinds CPU stacks with eBPF across Python and native frames, attributes CUDA kernels to the stacks that launched them, and with PC sampling, records the SASS instructions and stall reasons inside each kernel. Most teams debug a slow job by reproducing it and rerunning it under Nsight, hoping the straggler shows up again. With Zymtrace, the profiles from the moment it happened are already there.
The profiles answer three questions about each straggler:
- What was the late GPU doing while its peers waited? Its CUDA flamegraph and its host’s CPU flamegraph for the episode.
- Which call in your code issued the collective everyone was stuck in? The launch stack above the collective kernel on a healthy GPU, through PyTorch to the Python frame that issued it, when the launching thread has one.
- What did it cost? GPU time in that kernel, per GPU, over the window.
Coding agents get the same data through the Zymtrace MCP server, which exposes nccl_stragglers, nccl_slow_operations, and nccl_causes alongside flamegraphs and hot traces. Most of the numbers below came from those tools.
Use case 1: a software straggler from the data split
ByteDance prototyped a rebalancing fix for sequence-length imbalance and measured a 23.9% throughput gain on a 32K-context job [1]. We recreated a miniature version of the same mechanism on a single 8× H100 node.
| Model | GPT-2 medium, 350M parameters |
| Parallelism | FSDP, 8 ranks |
| Hardware | 8× H100 SXM with NVSwitch |
| Software | PyTorch 2.10, NCCL 2.29 (nvcr.io/nvidia/pytorch:26.01-py3) |
| Data | samples of 256 to 4,096 tokens, fixed seed |
| Profiling | Zymtrace 26.10.3 with CUDA profiling, straggler detection, and PC sampling |
The GPUs ran at full clocks with no NVLink errors. The sequence lengths stand in for audio clips or video segments of different durations. The full v1 and v2 code for both use cases, and the script that runs them, is in this gist.
Beyond the scale, the setup differs from ByteDance’s in how micro-batches are formed. Their jobs pack randomly chosen sequences into micro-batches up to a fixed token budget, so the imbalance comes from the quadratic attention cost alone and lands on a different rank each step. Our v1 pads fixed-size micro-batches and always hands rank 7 the longest sequences, so rank 7 carries more tokens as well as the quadratic attention cost, and the same rank straggles in every window.
v1: the straggler
To keep padding low, shard_global_batch() in seqlen-v1.py sorts each global batch by length and gives every rank the same number of samples, cut contiguously from the sorted list:
def shard_global_batch(lengths, rank, world):
    order = sorted(range(len(lengths)), key=lengths.__getitem__)
    per_rank = len(order) // world
    return order[rank * per_rank:(rank + 1) * per_rank]
Rank 7 always receives the longest sequences, with 1.76× the mean padded tokens. FSDP all-gathers parameters and reduce-scatters gradients at every layer, so all eight ranks run at rank 7’s pace.
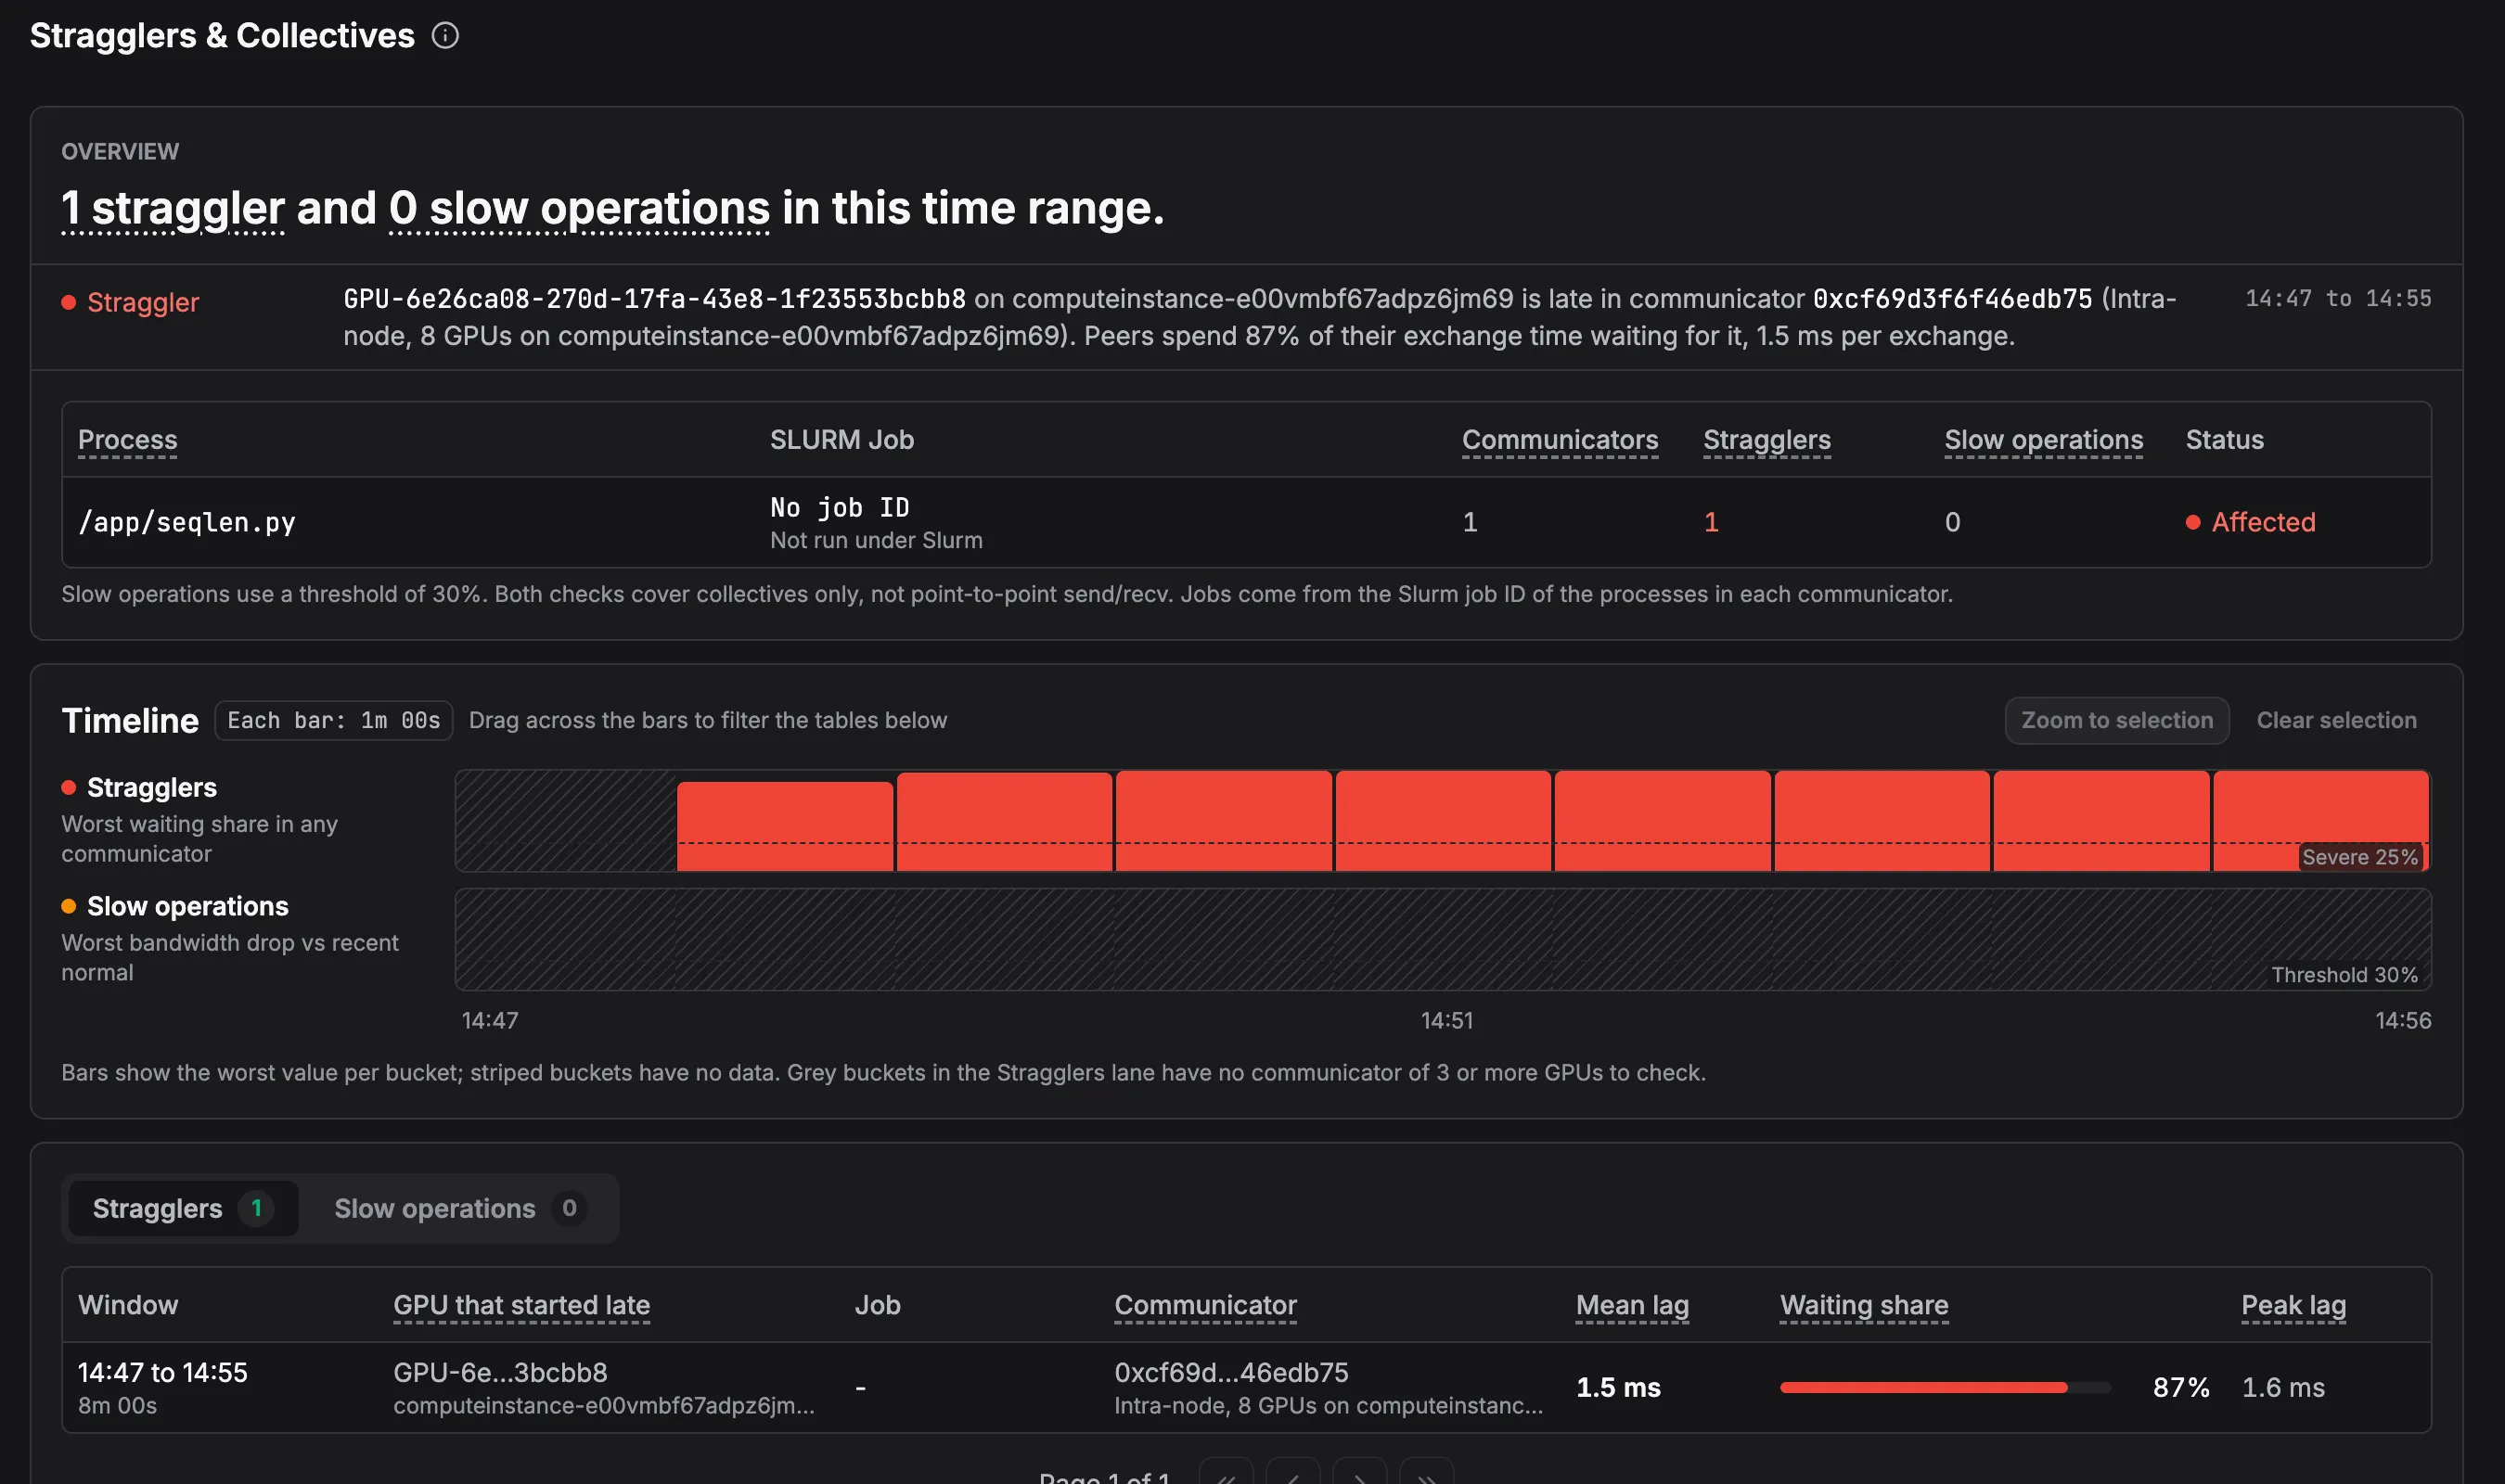
The GPU Stragglers feature flags rank 7 for the entire run:
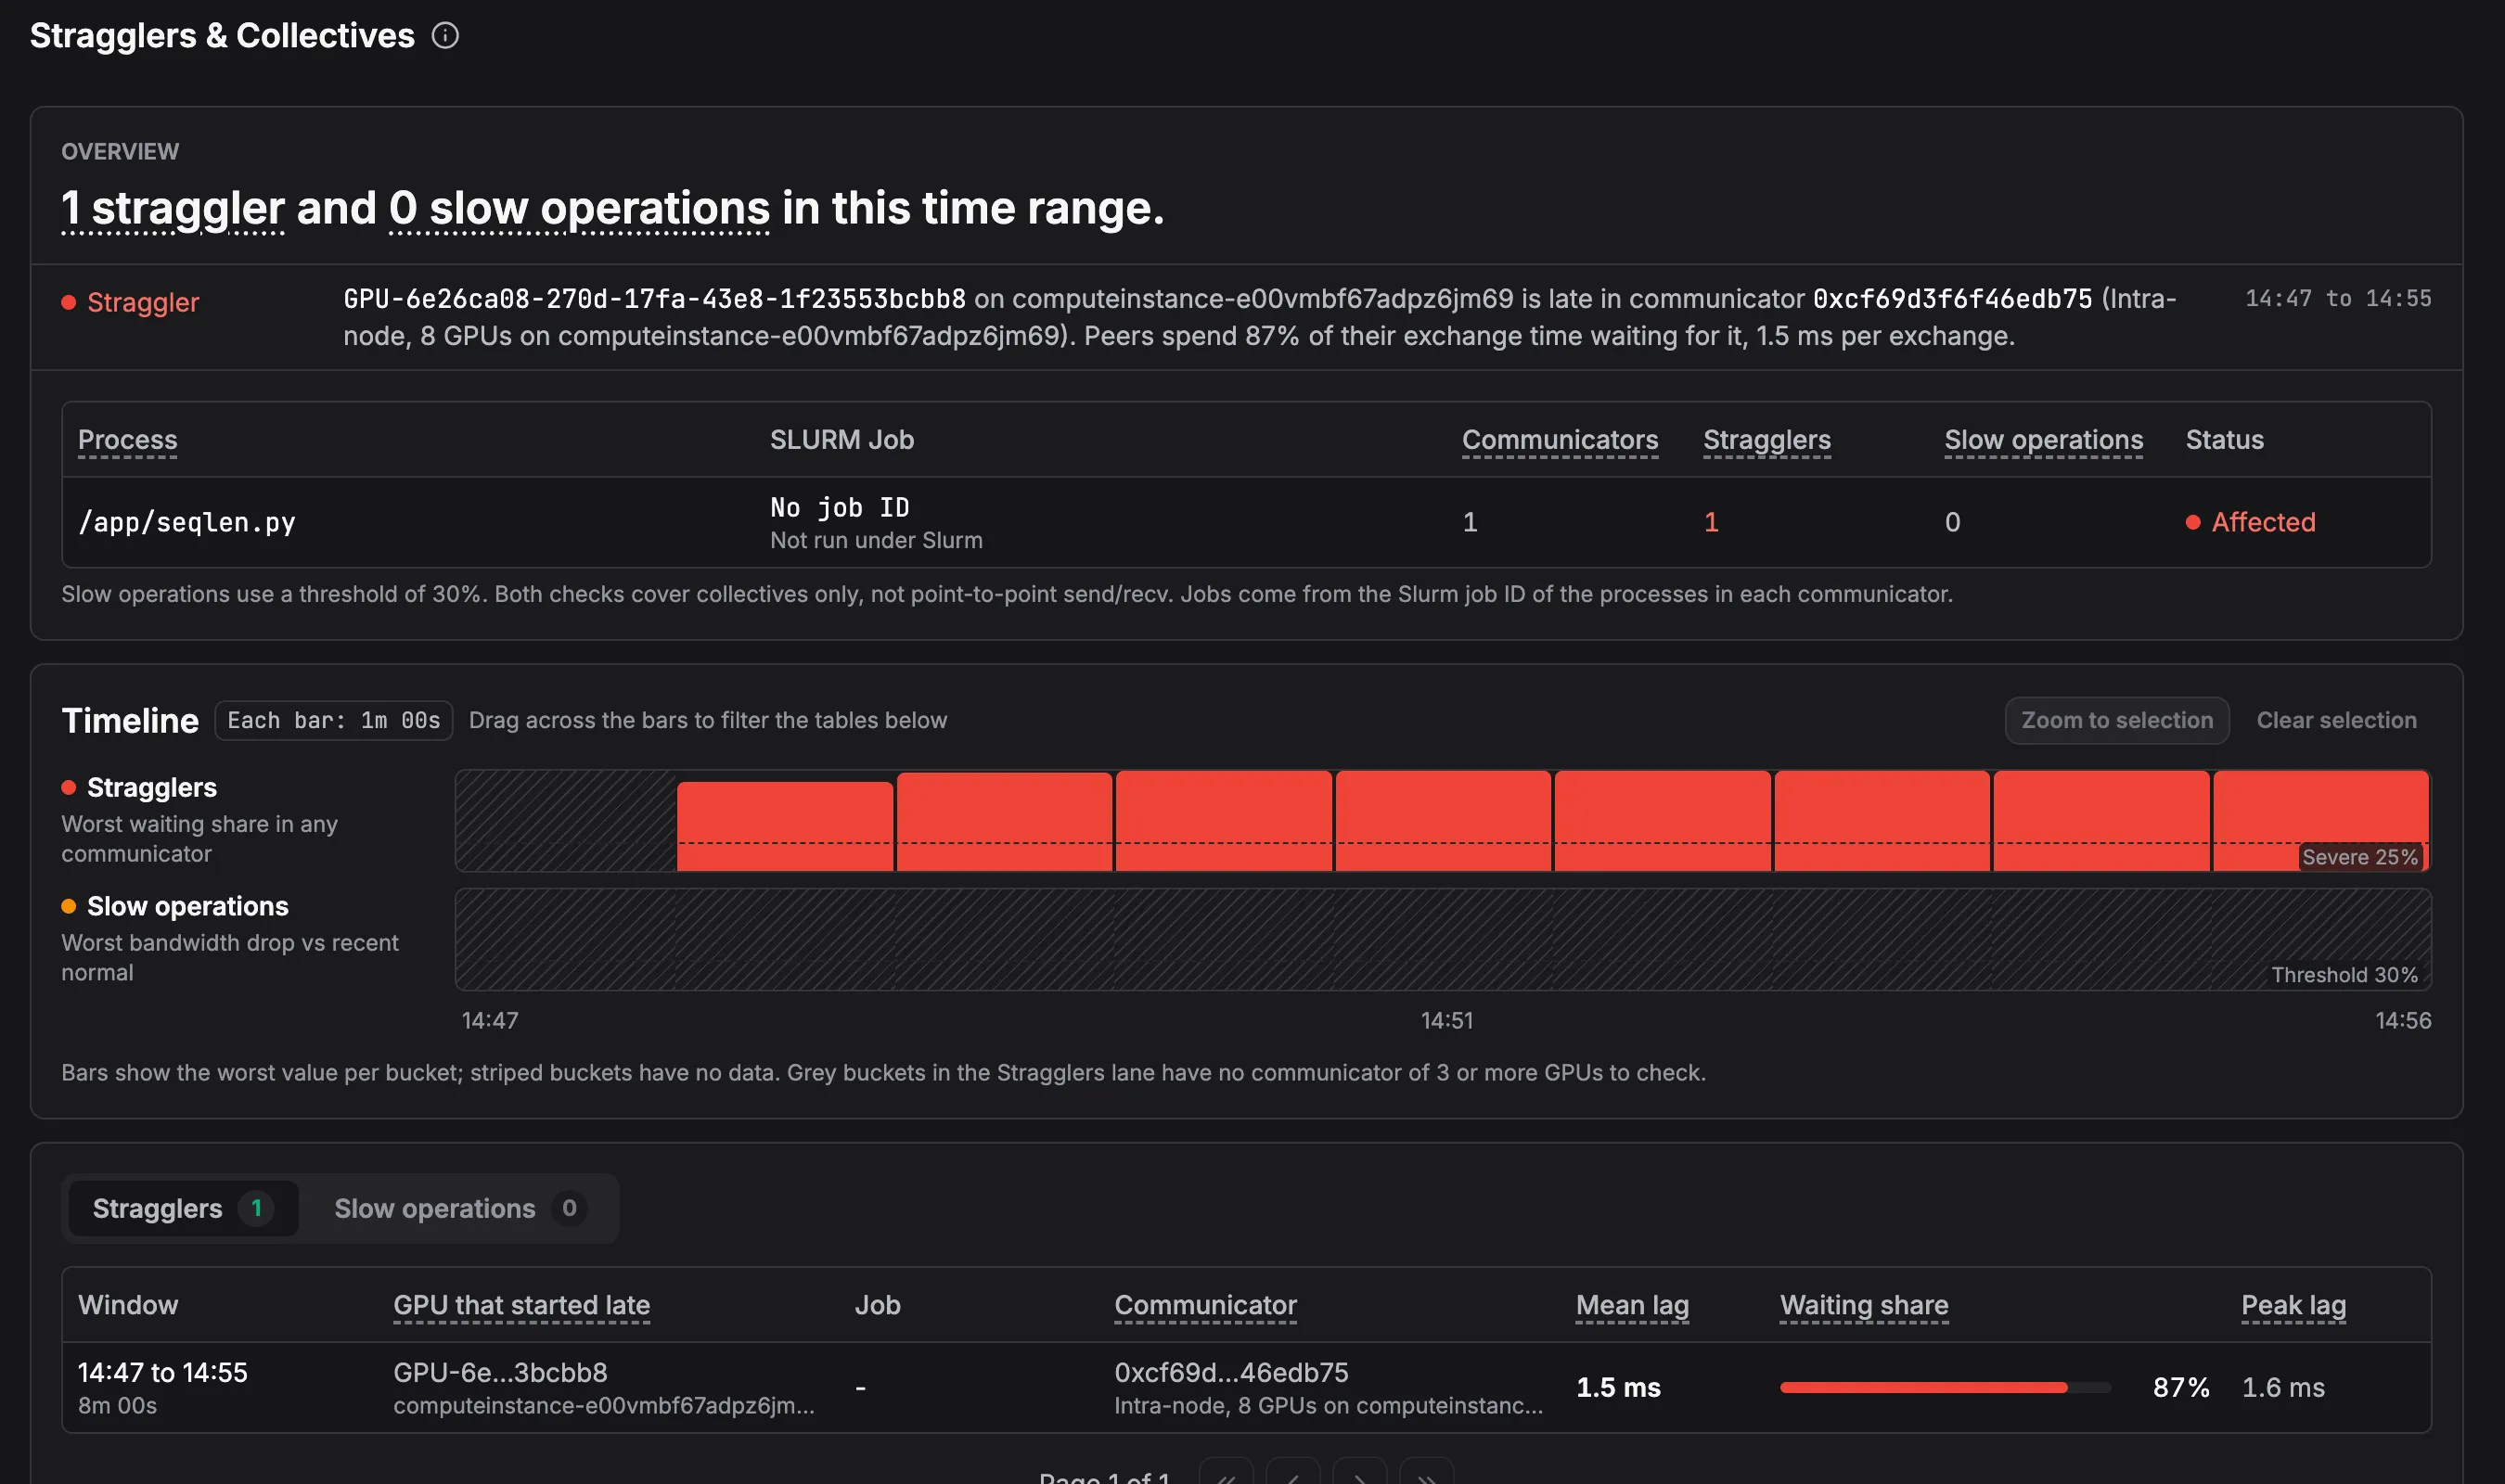
seqlen-v1: GPU-6e26ca08 is the straggler, with peers waiting 87% of their exchange time.
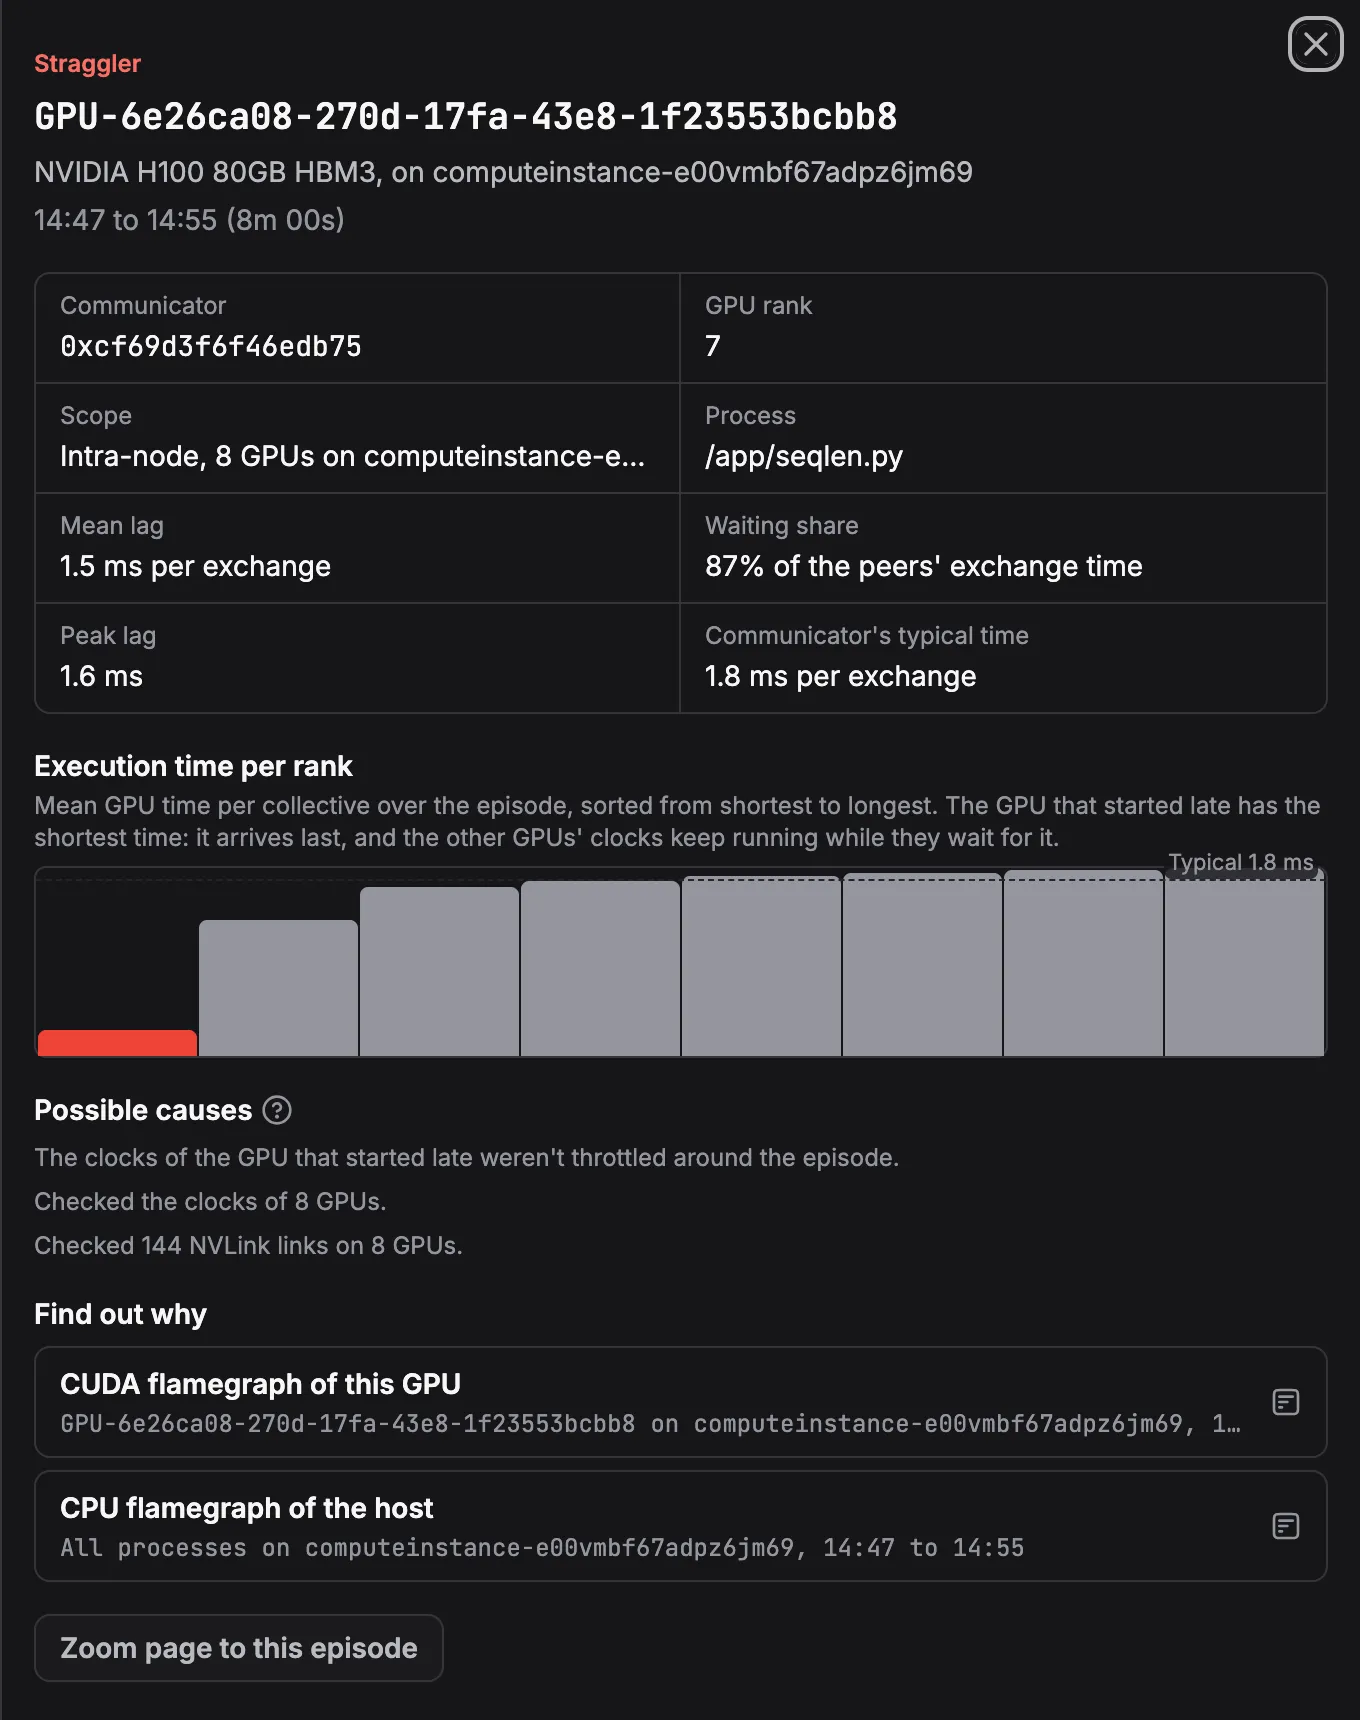
Opening the straggler gives the detail behind that line:
- Straggler: rank 7 (
GPU-6e26ca08…). Mean lag 1.5 ms per exchange, peak 1.6 ms, against a typical collective time of 1.8 ms for the communicator. - Execution time per rank: each rank’s time in collectives follows the data split. Rank 0, with the shortest sequences, spends 1.88 ms in each collective, rank 6 spends 1.35 ms, and rank 7 spends 0.23 ms. The ranks with the least work wait the longest.
- Possible causes: the late GPU’s clocks weren’t throttled, and the check covered the clocks of all 8 GPUs and 144 NVLink links. With clocks and NVLink cleared, the workload is the next suspect.
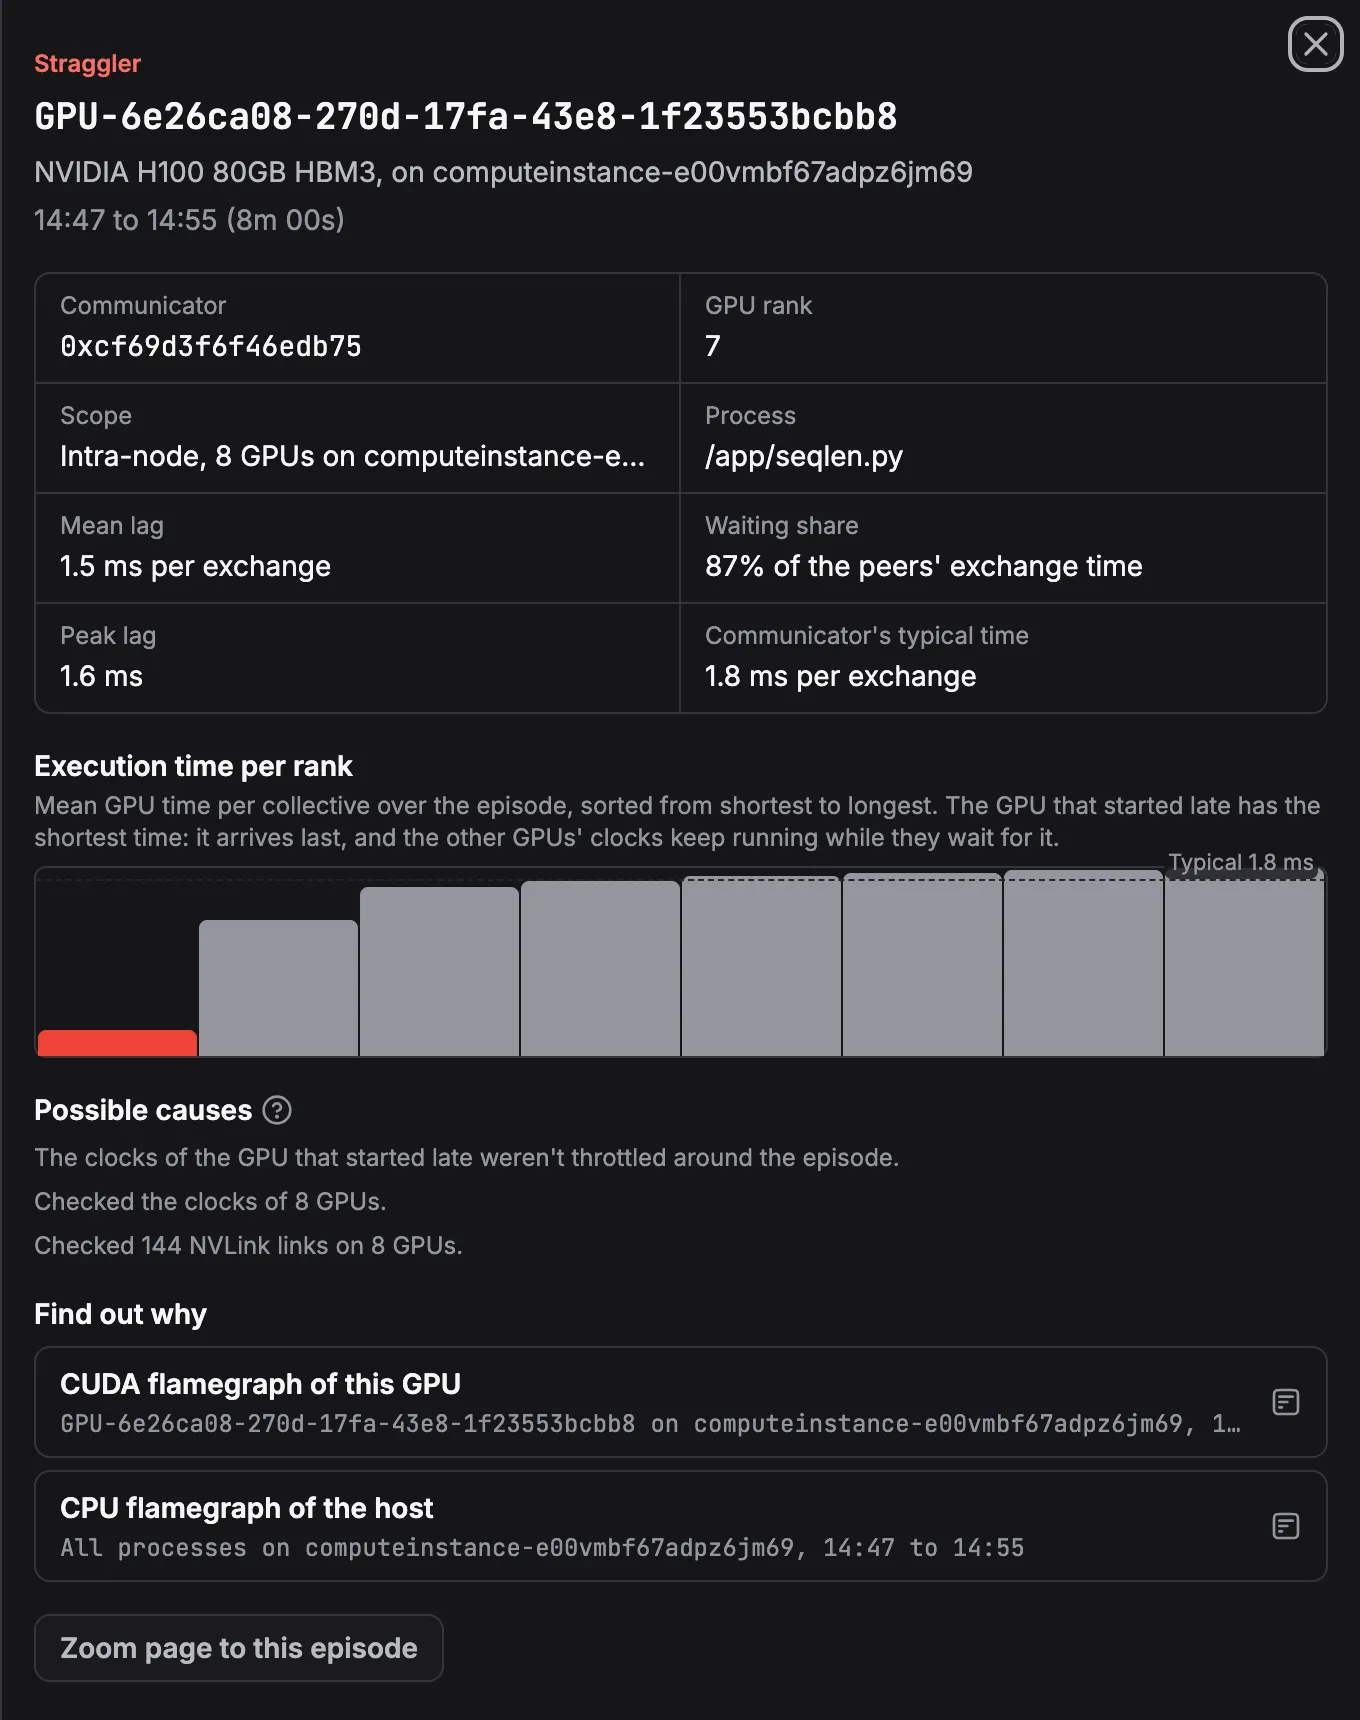
The straggler pane for rank 7, with per-rank execution times and possible causes.
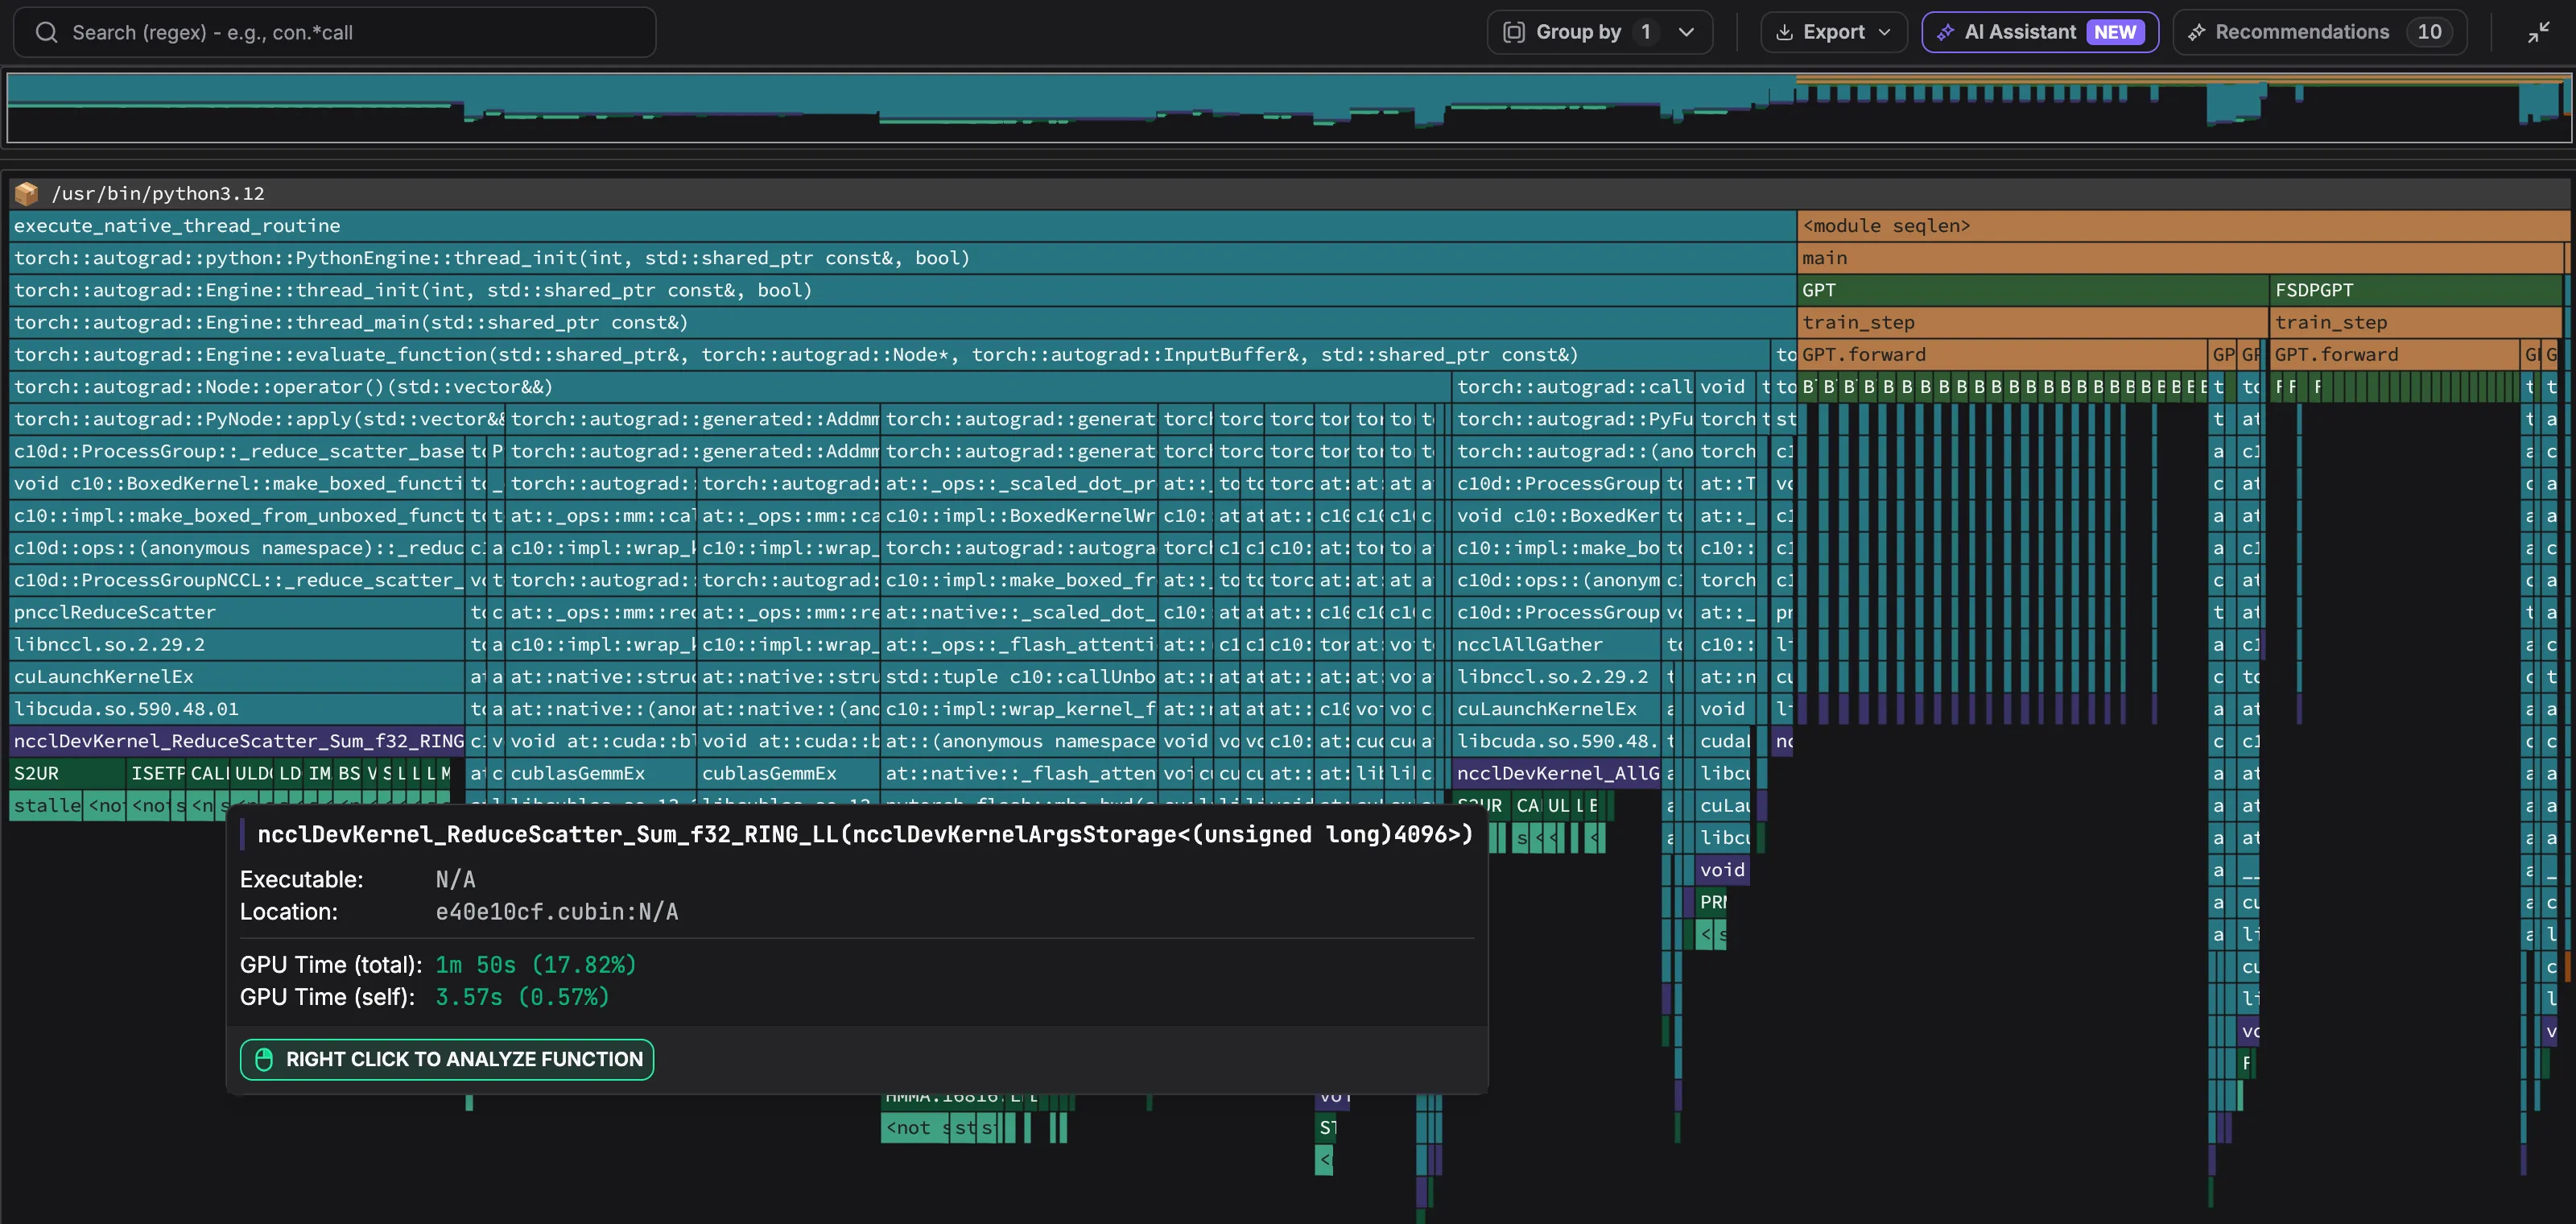
The drill-down shows which collective the healthy GPUs are stuck in. In GPU 0’s CUDA flamegraph for the same window, FSDP’s gradient reduce-scatter runs from the autograd engine through c10d::ProcessGroupNCCL::_reduce_scatter_base and pncclReduceScatter into ncclDevKernel_ReduceScatter_Sum_f32_RING_LL, which takes 3m 20s, 35% of the GPU time recorded on GPU 0 in that window. Together with the all-gathers, FSDP’s collectives take 60% of GPU 0’s GPU time. The per-rank execution times suggest most of that is waiting for rank 7 inside the collectives. GPU 0 spends 1.88 ms in each collective, and rank 7, which barely waits, spends 0.23 ms.
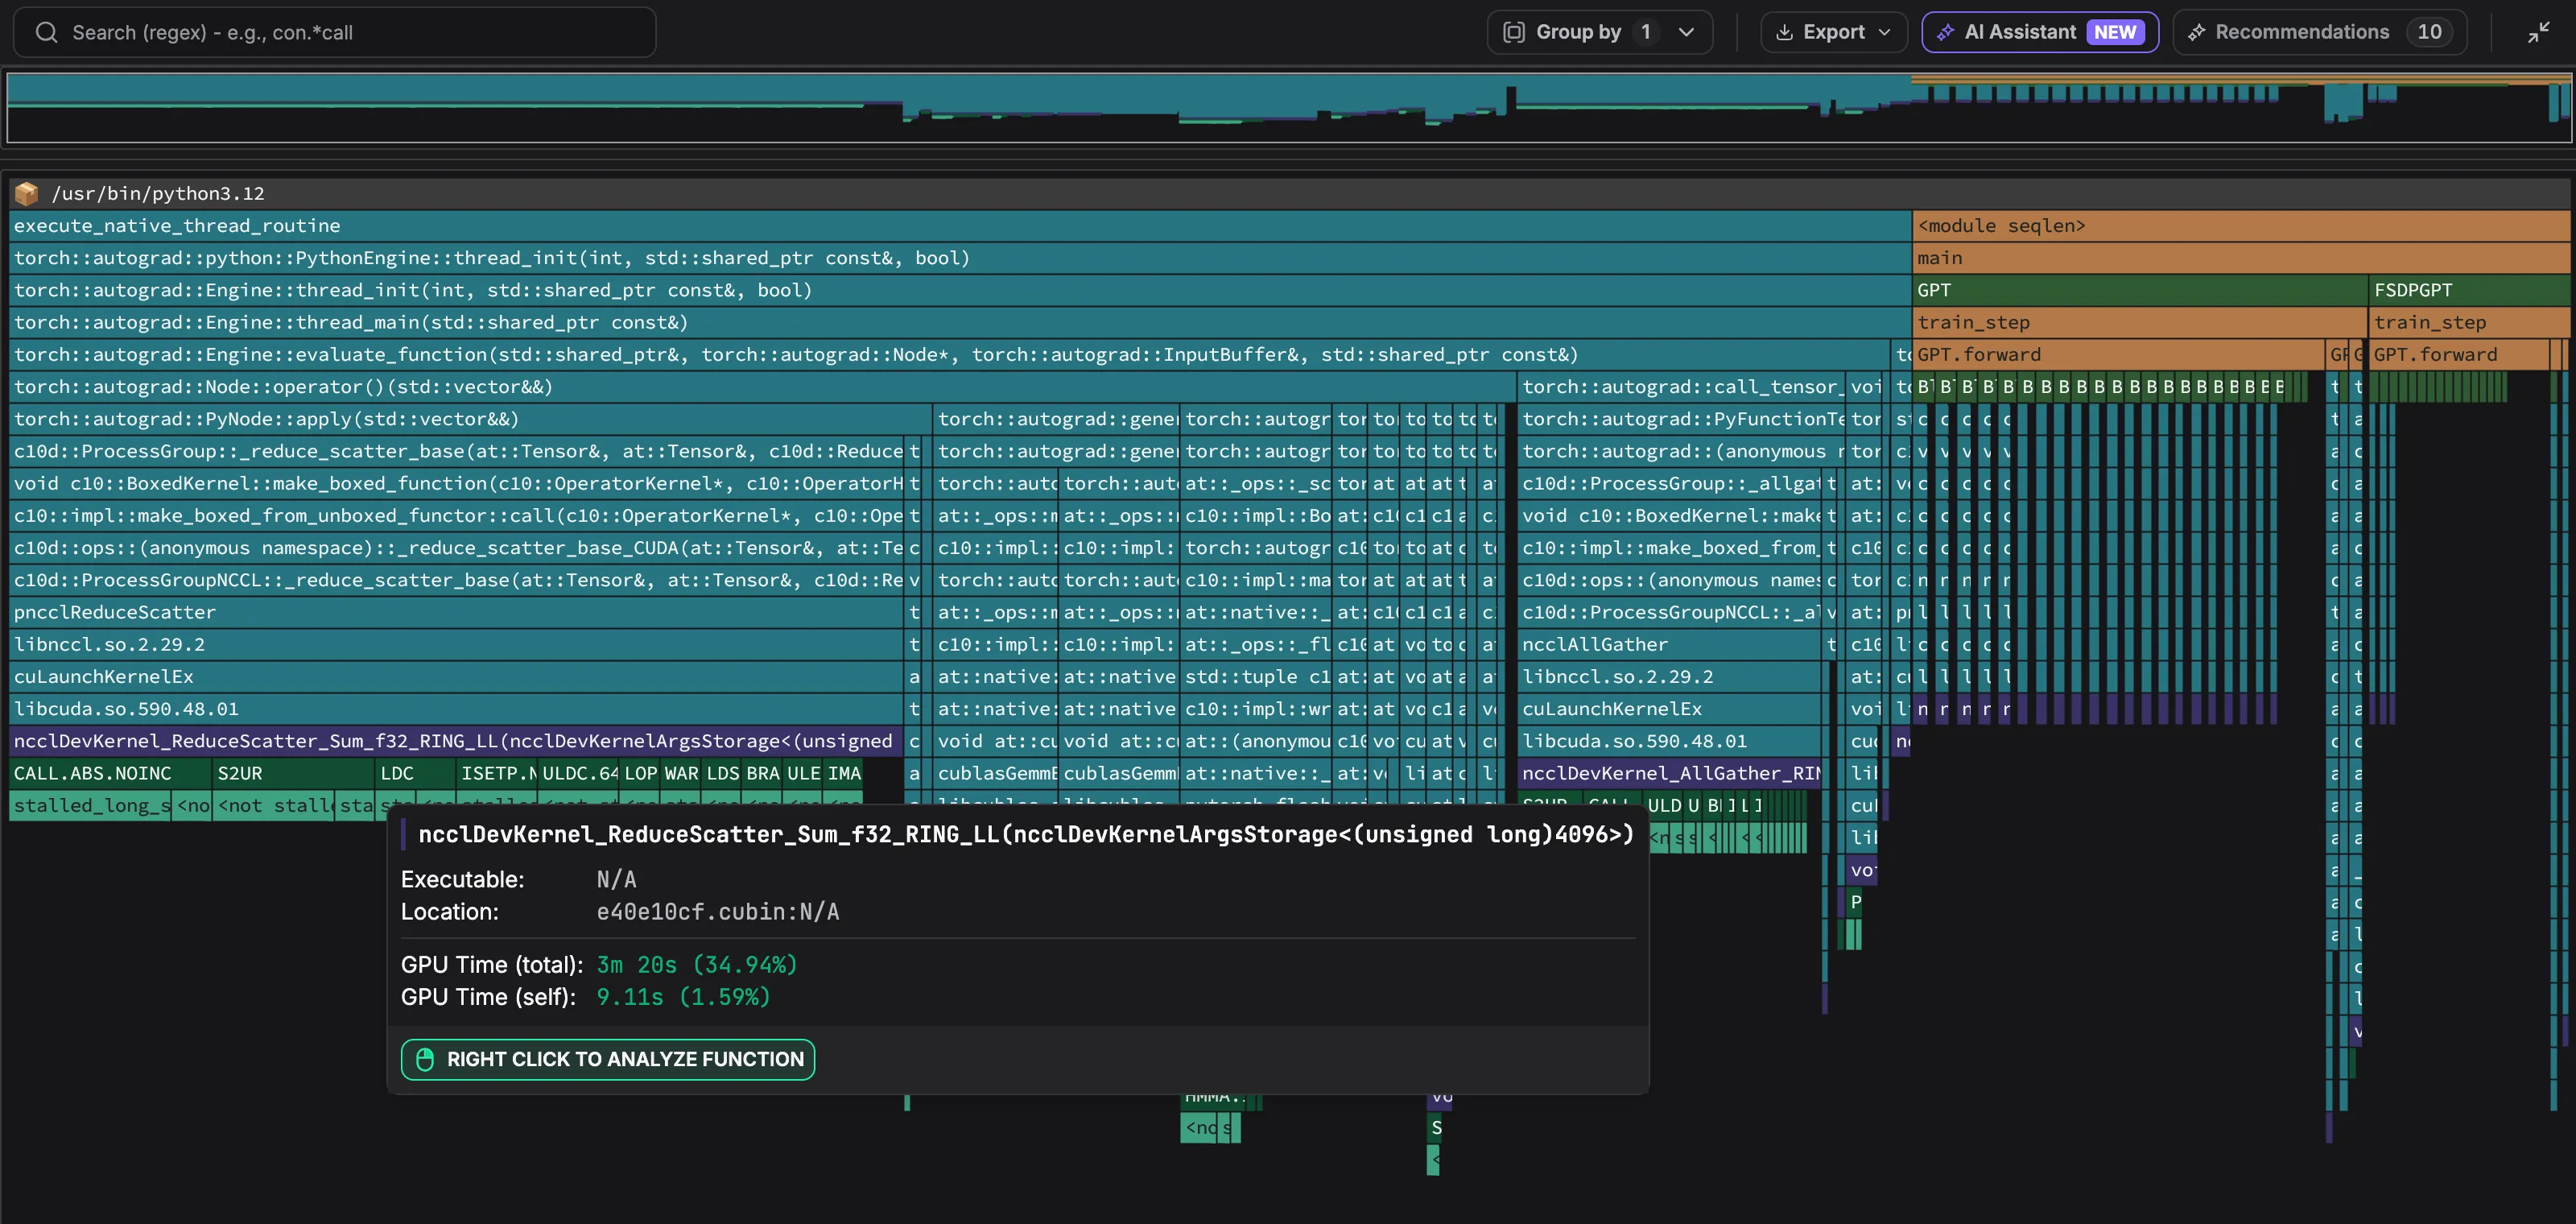
seqlen-v1: the reduce-scatter kernel takes 34.94% of GPU 0's GPU time.
v2: the fix
v2 (seqlen-v2.py) builds the same length-sorted micro-batches and deals them out round by round, reversing direction each round, so every rank gets a similar mix of short and long sequences. The micro-batches and their padding are identical. Only their assignment to GPUs changes, so with a real dataset the global batch and its gradient stay the same. ByteDance’s prototype goes further, predicting each micro-batch’s cost from the sum of its squared sequence lengths and partitioning sequences across ranks by that cost. Dealing sorted micro-batches is the simple version, and it’s enough here.
 def shard_global_batch(lengths, rank, world):
     order = sorted(range(len(lengths)), key=lengths.__getitem__)
-    per_rank = len(order) // world
-    return order[rank * per_rank:(rank + 1) * per_rank]
+    micro = [order[k:k + MICRO_BATCH] for k in range(0, len(order), MICRO_BATCH)]
+    rounds = [micro[k:k + world] for k in range(0, len(micro), world)]
+    return [i for n, rnd in enumerate(rounds)
+ for i in (rnd if n % 2 == 0 else rnd[::-1])[rank]]| v1 | v2 | |
|---|---|---|
| Stragglers | rank 7, peers waiting 87% | none |
| Collective time per rank | 1.88 ms on rank 0 down to 0.23 ms on rank 7 | 0.71–0.79 ms on every rank |
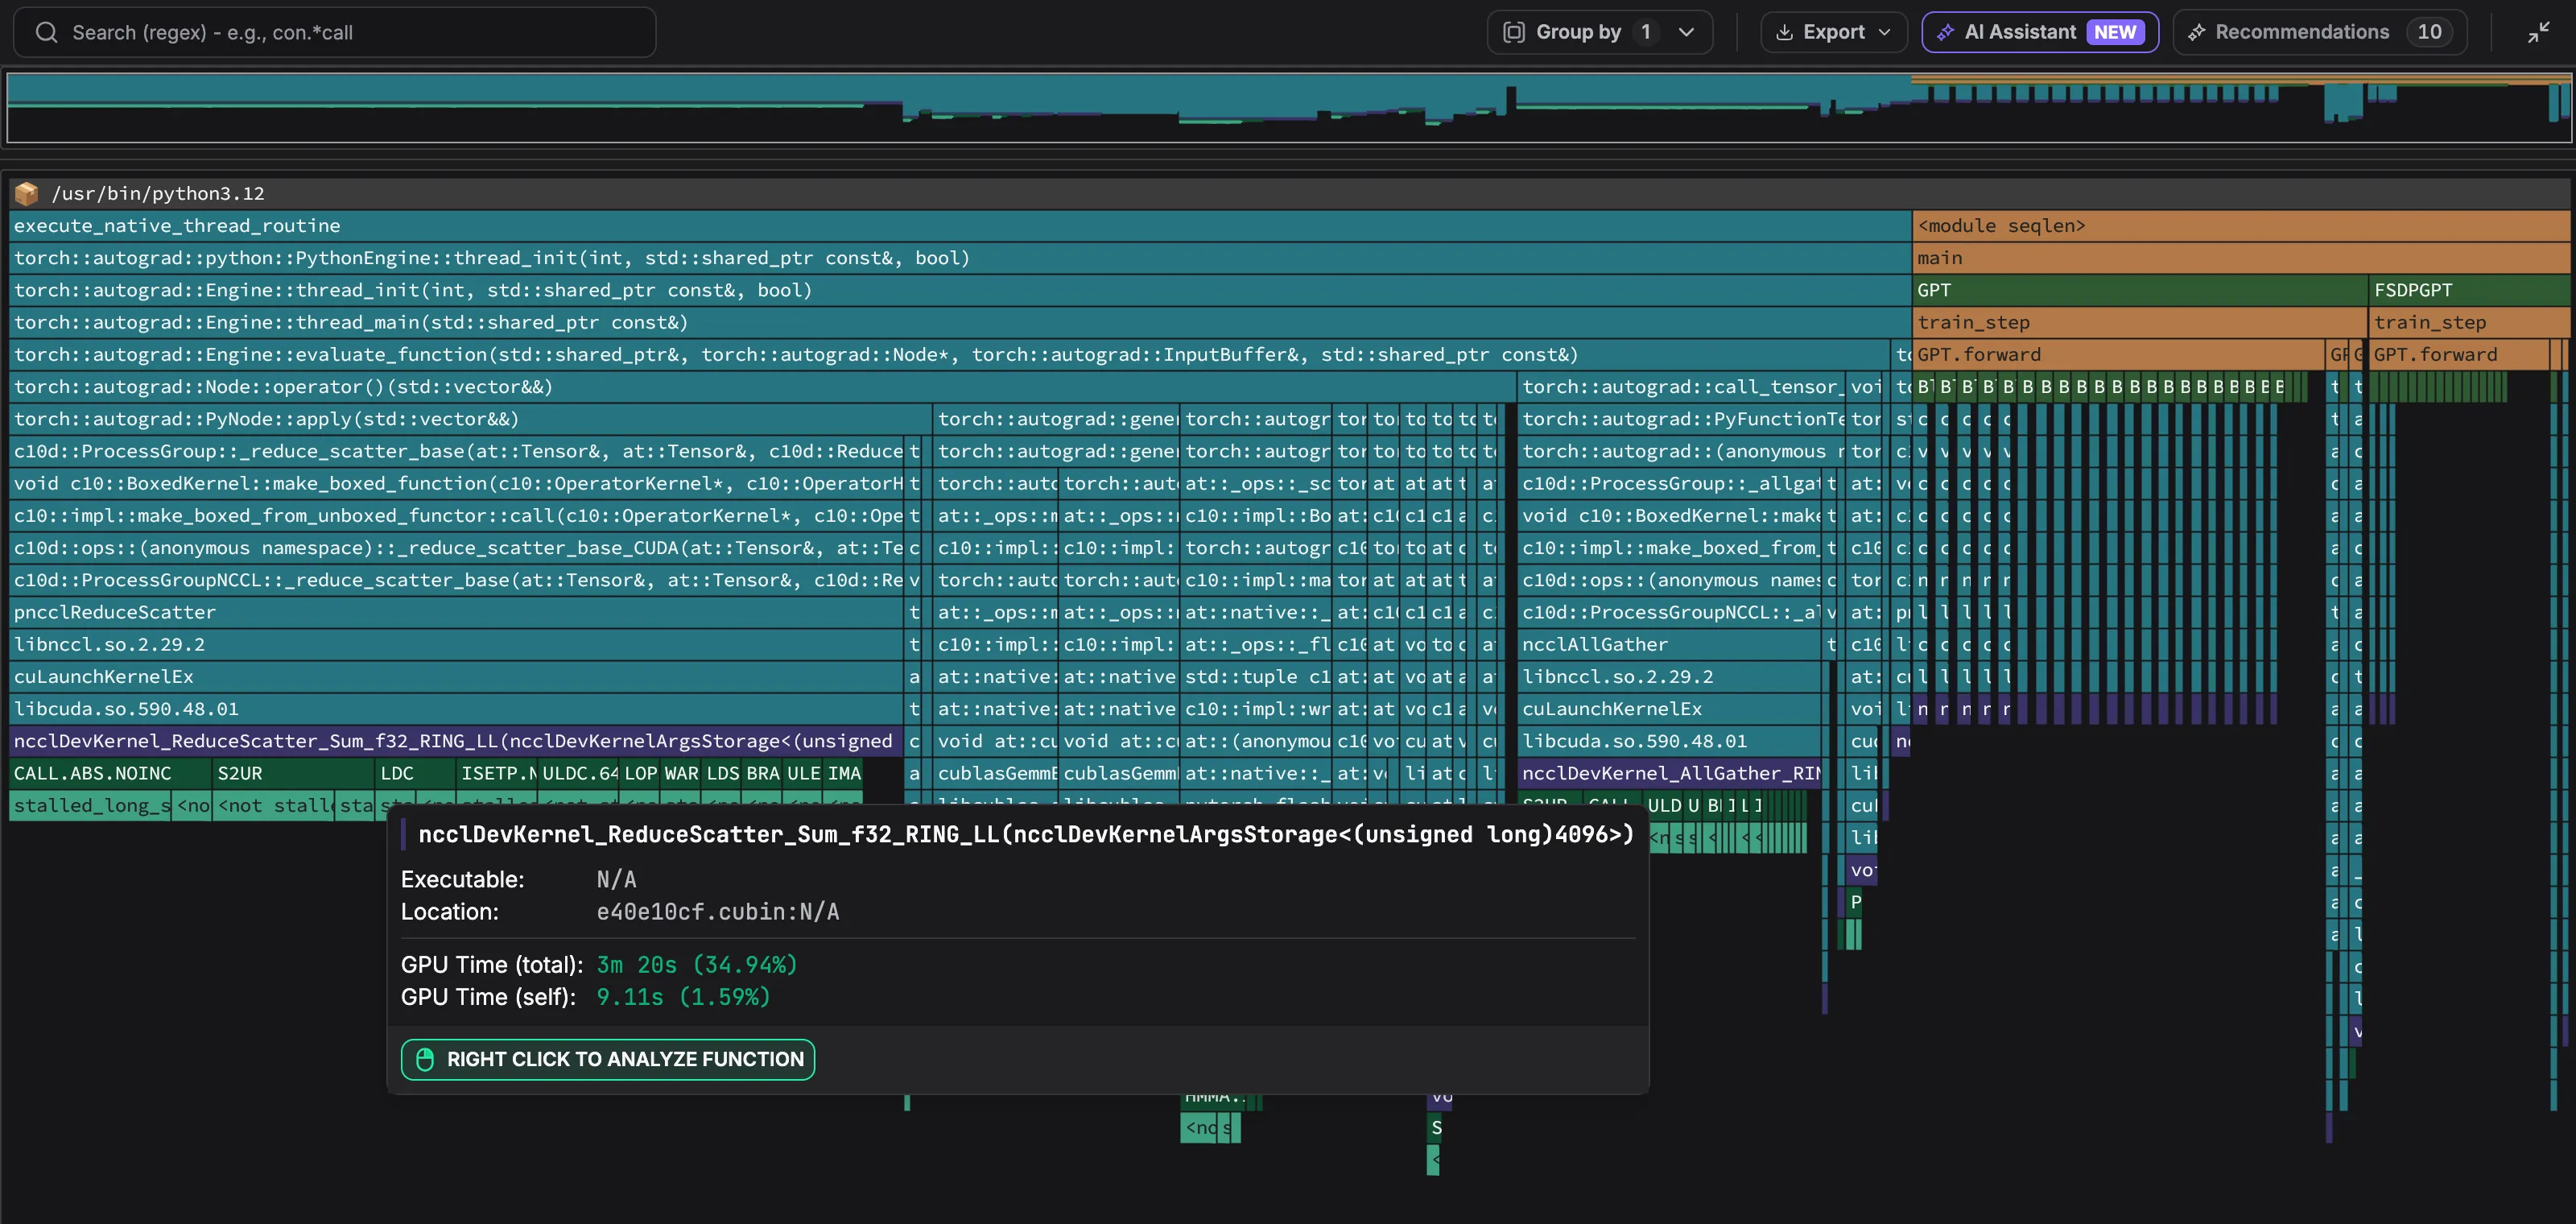
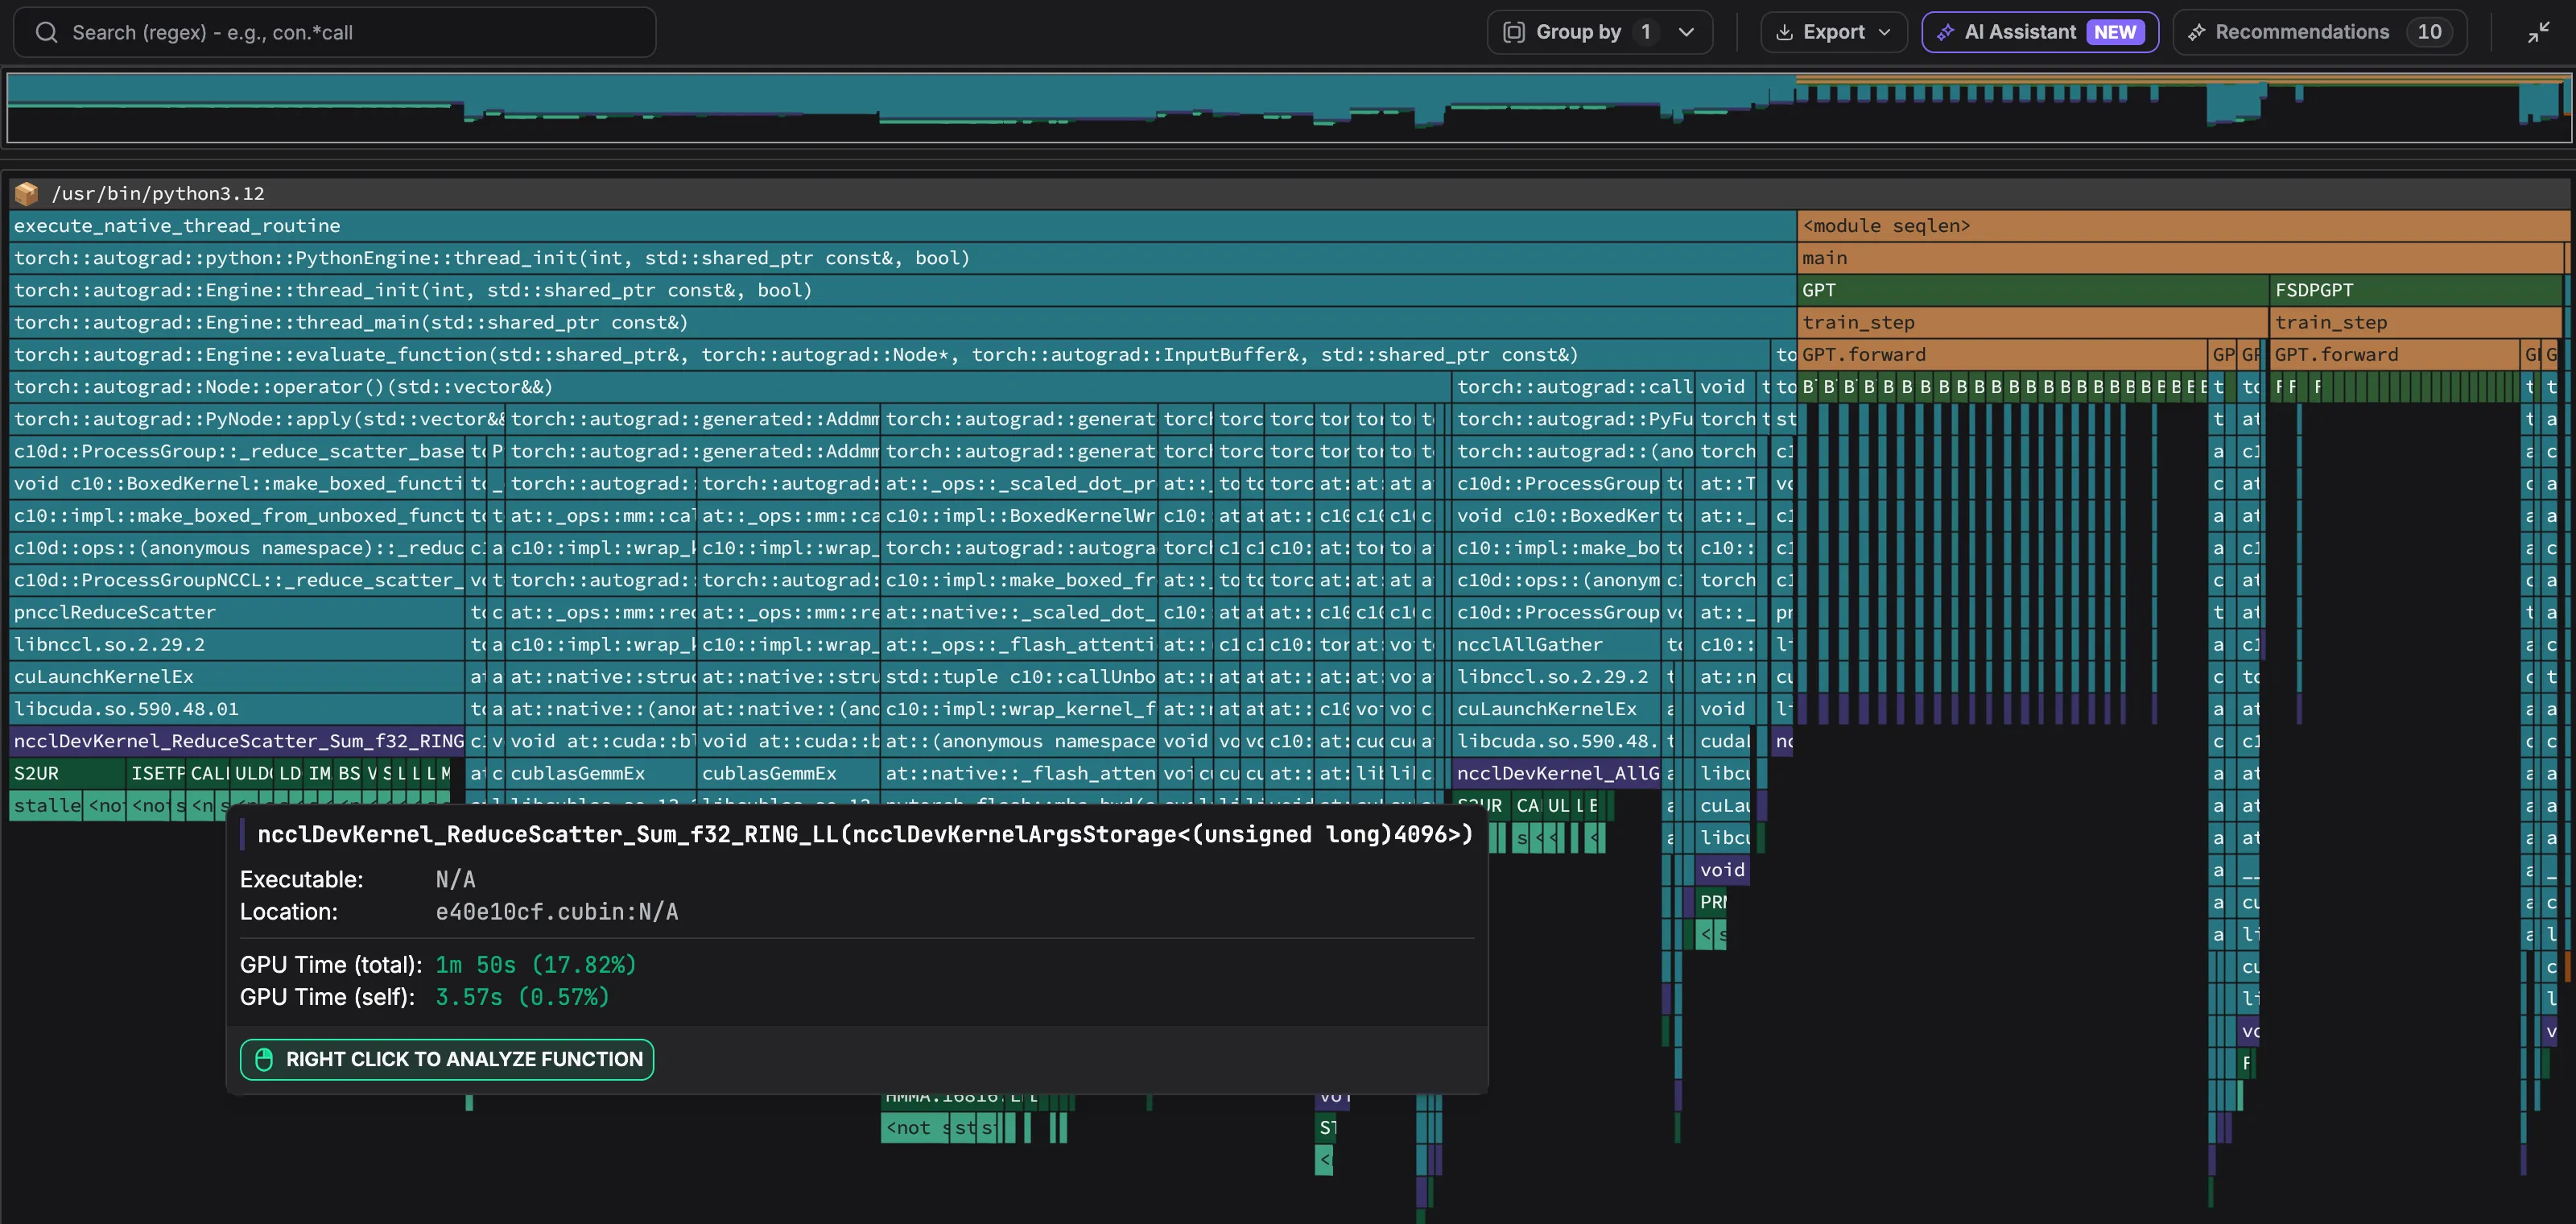
| Reduce-scatter kernel, share of GPU 0 time | 34.9% | 17.8% |
| All collective kernels, share of GPU 0 time | 60% | 38% |
| Step time | 1,131 ms | 796 ms |
| Throughput | 493k tokens/s | 700k tokens/s |
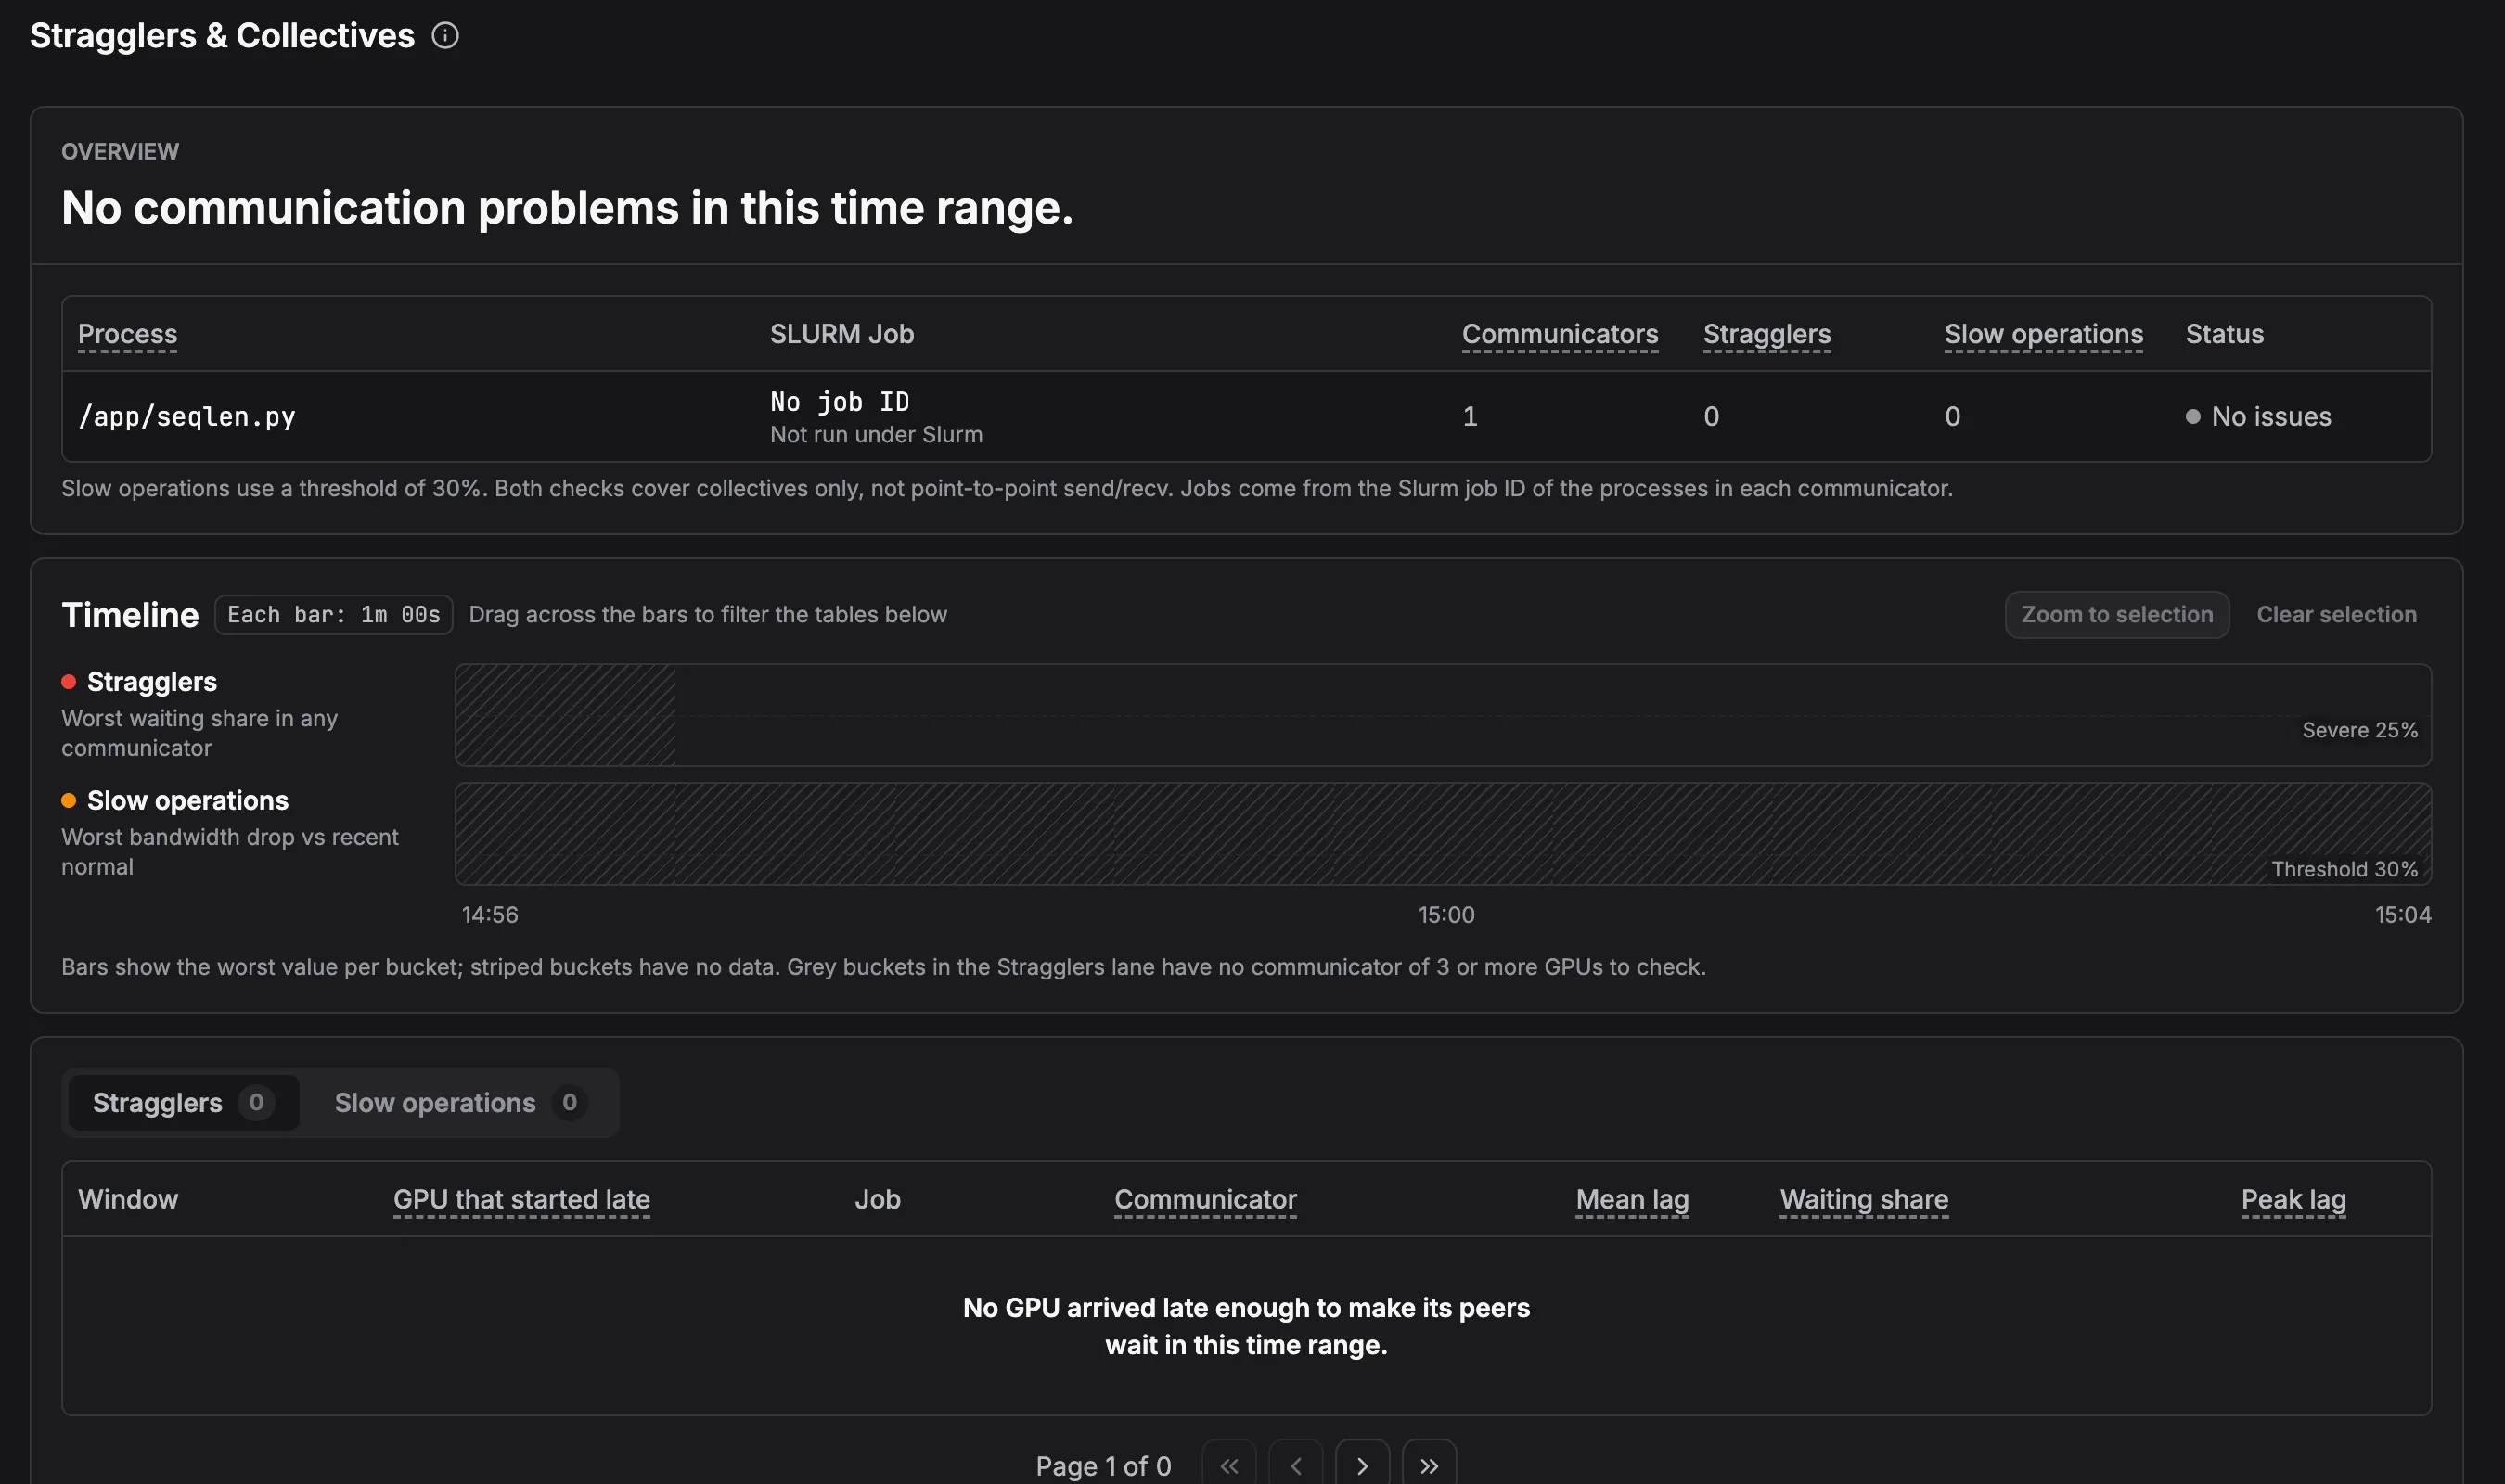
With the same model, sequence lengths, and padding, v2 runs 1.42× faster. Collective time per rank is now flat, at 0.71–0.79 ms, and no rank is persistently late.
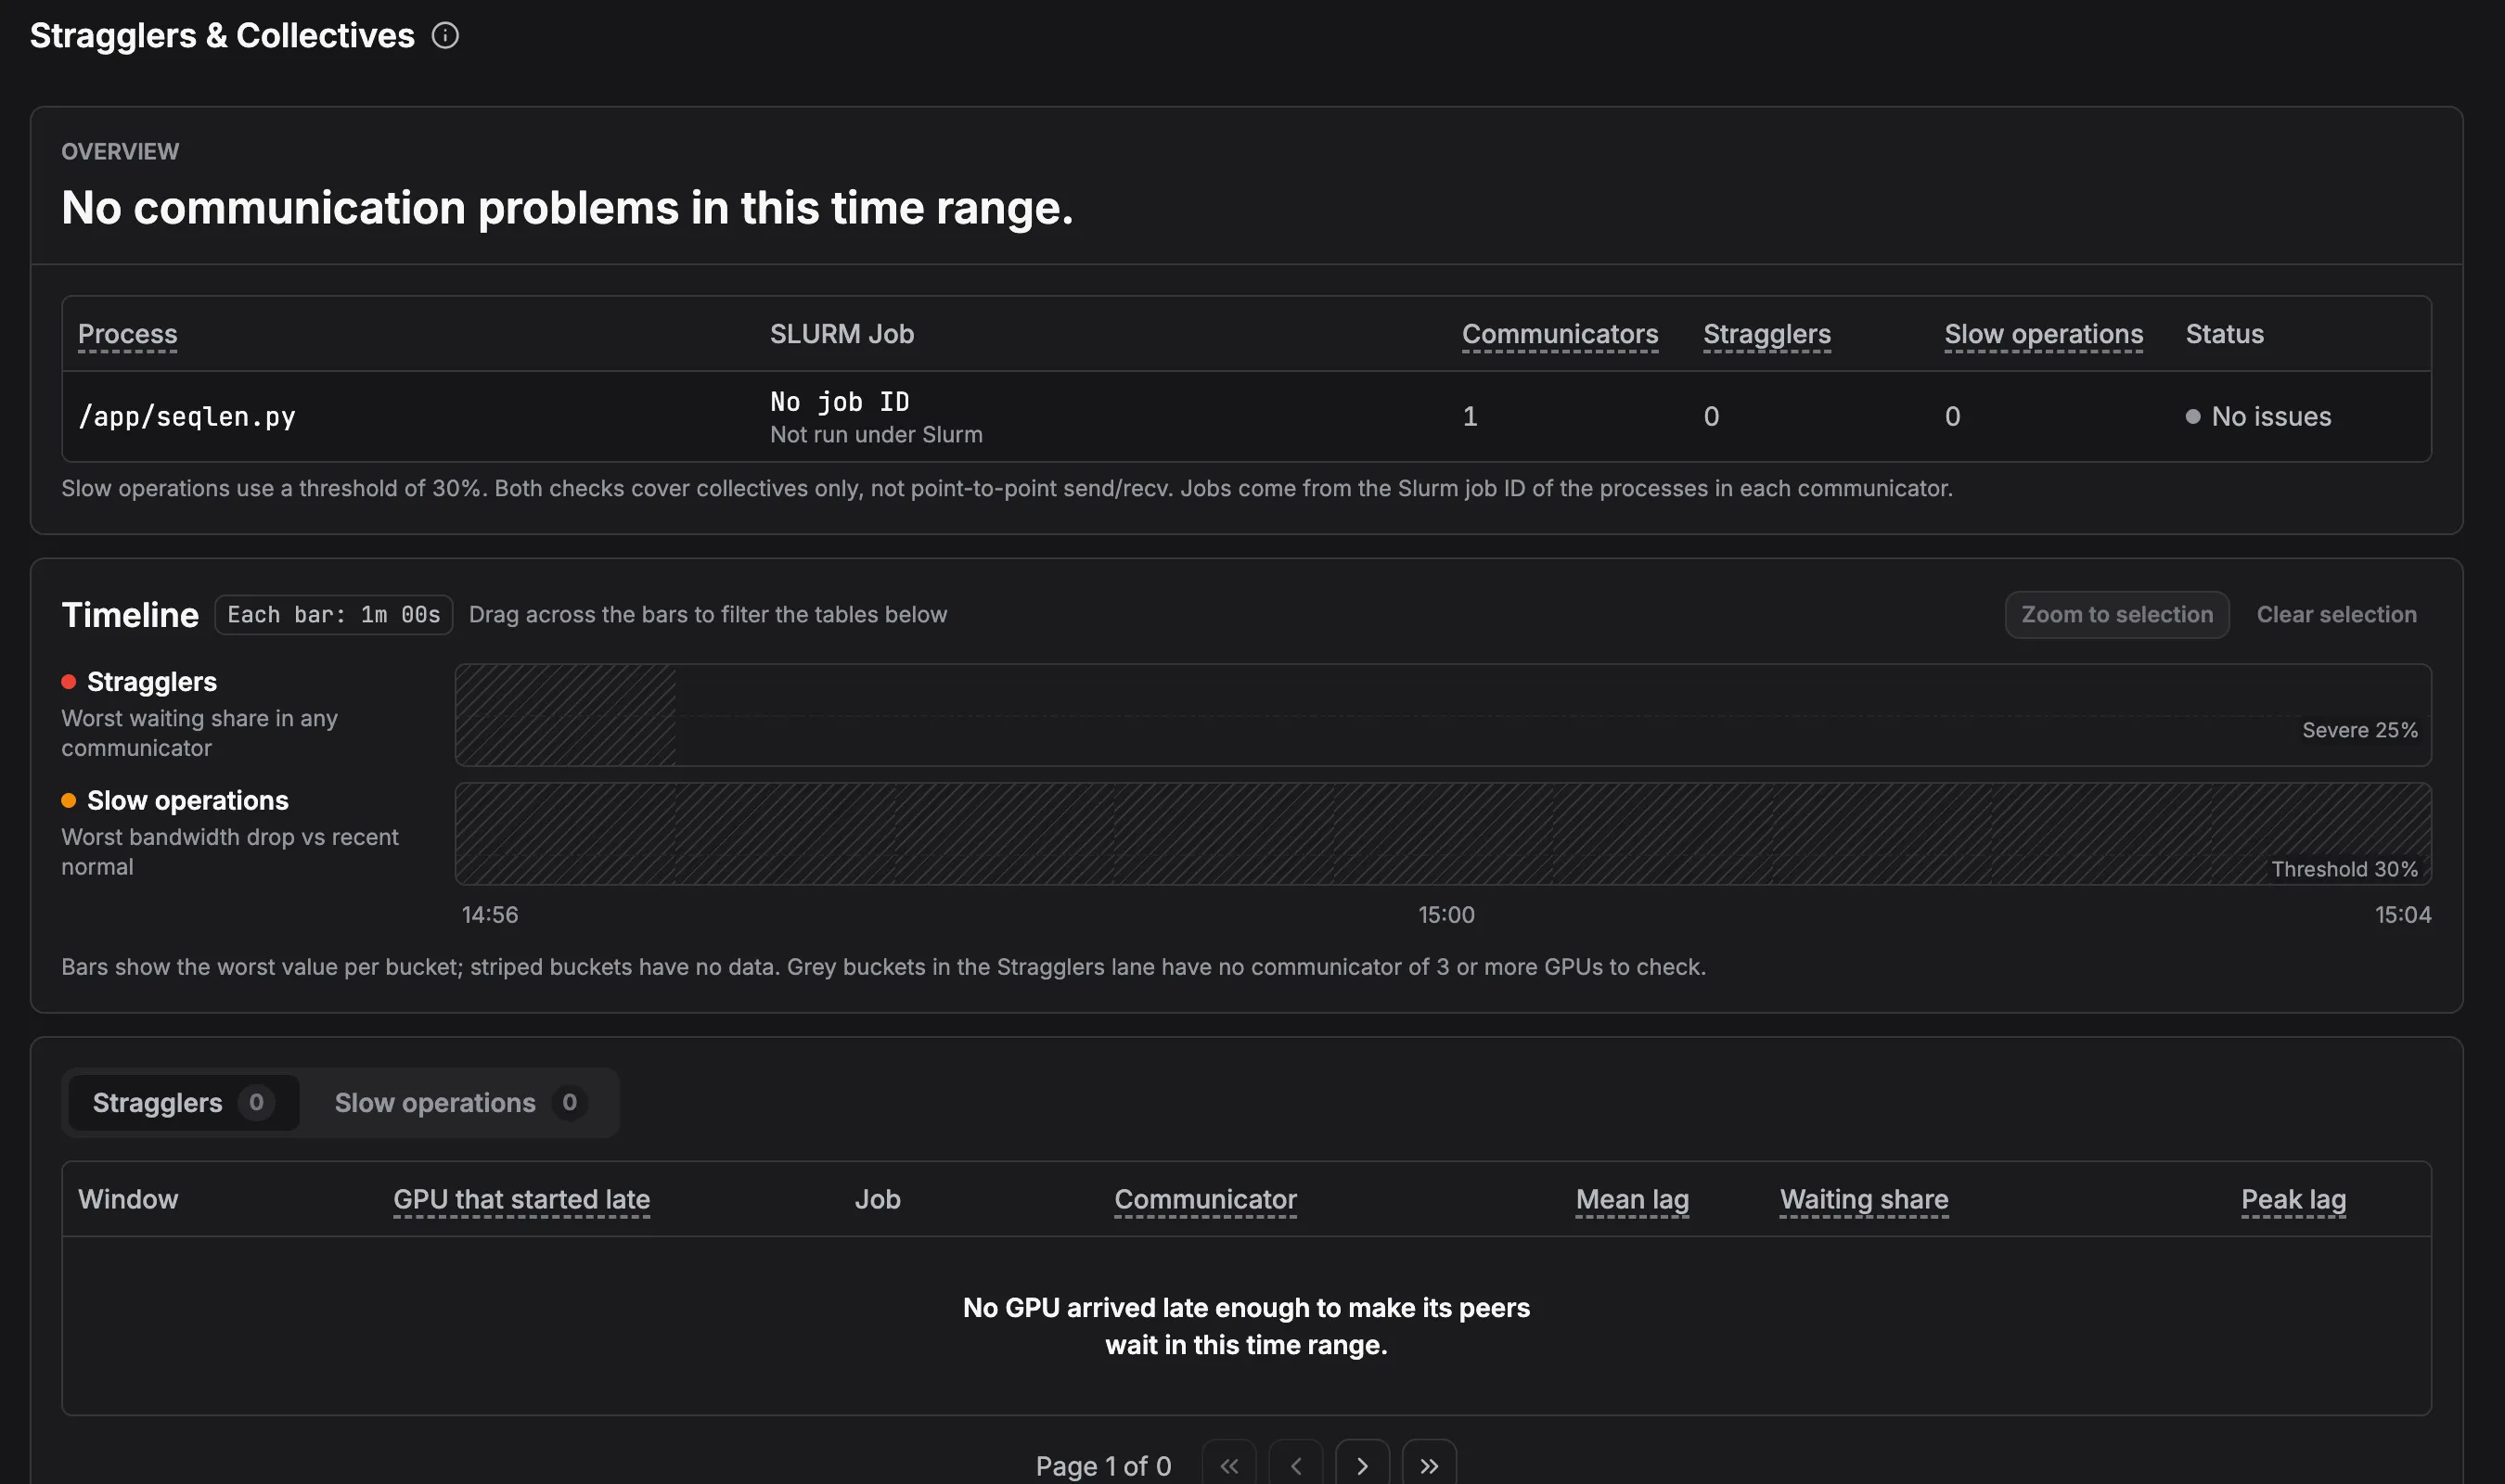
seqlen-v2: no stragglers.
seqlen-v2: the reduce-scatter kernel drops to 17.82% of GPU 0's GPU time.
Our first fix didn’t go as planned
Our first attempt at v2 ran with PyTorch’s cuDNN attention backend. The data split was balanced, with rank 7 down to 1.00× the mean padded tokens, yet the job got slower, at 1,323 ms per step against v1’s 1,201 ms. Zymtrace flagged a new straggler on a different GPU, rank 4, late in 4 windows over 2 episodes, with its peers spending 24.8% of their collective time waiting.
The profiles pointed at attention, on the CPU side. In the GPU profile, cuDNN’s attention kernels took only 7% of GPU time across the eight GPUs, while the collectives took 59%, so the GPUs spent most of the run waiting. In the CPU profile, Attention.forward took 13.5% of the v2 container’s CPU time. We disabled cuDNN attention in both versions with one line in main(), and PyTorch fell back to FlashAttention:
 def main():
     local_rank = int(os.environ["LOCAL_RANK"])
     torch.cuda.set_device(local_rank)
+    torch.backends.cuda.enable_cudnn_sdp(False)
     dist.init_process_group("nccl")
That cut Attention.forward to 3.1% of CPU time and the collectives to 39% of GPU time, brought v2 to 796 ms per step, and removed the straggler. The results above use that configuration.
This is why profiling has to run continuously. The fix changed the workload, and the straggler moved to a GPU that had been fine before. A profile taken before the change could never have shown it, and a later rerun under a profiler might not have reproduced it. Zymtrace caught the new straggler, and the profile that explained it, as soon as it appeared, because both were already running.
Use case 2: a hardware straggler from a throttled GPU
The second use case (throttle-v1.py and throttle-v2.py) uses the same model with DDP on the same node. nvidia-smi -lgc locks GPU 7’s SM clock at 40% of its maximum for 4 minutes, releases it for 2, and locks it again, simulating a thermally throttled GPU the same way FALCON injected compute slowdowns in its evaluation [2].
- Straggler: rank 7, with its peers spending 76% of their exchange time waiting for it, 1.7 ms per exchange, against a typical collective time of 2.2 ms for the communicator.
- Possible causes: “Rank 7 ran at 795 MHz, 60% below its peers’ 1,975 MHz”, marked Degraded, with no NVLink errors across 144 links.
- Per-rank collective time: about 2.2 ms on ranks 0–6 and 0.54 ms on rank 7.
- Training log: a throttled step took 1,017 ms. On the healthy ranks, an estimated 498 ms was compute, and the remaining 519 ms went to the all-reduce and the optimizer step, mostly waiting for rank 7.
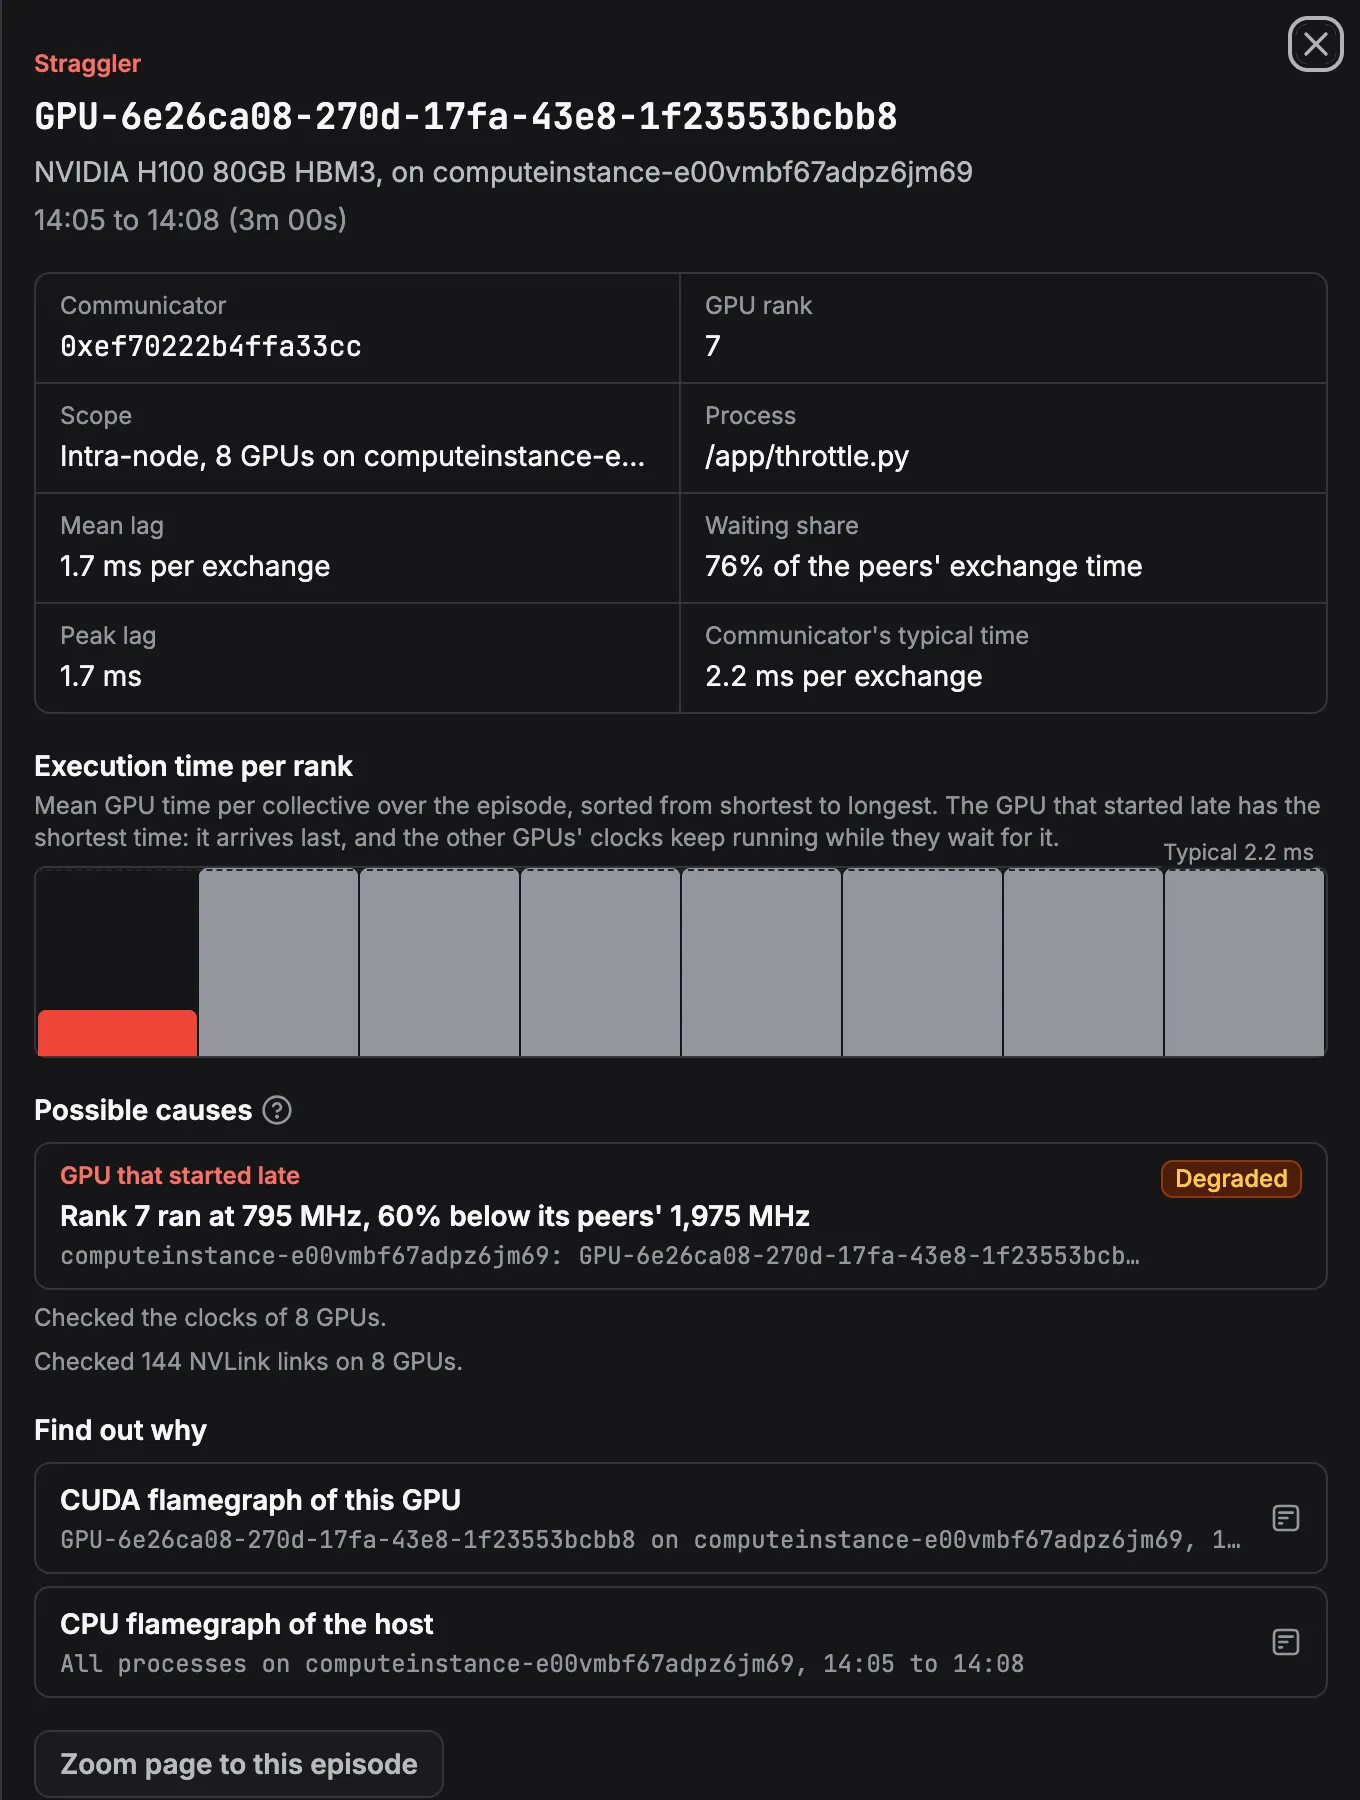
throttle-v1: rank 7 ran at 795 MHz, 60% below its peers.
Here the fix is operational. Repair or drain the GPU, which Zymtrace identifies by host, UUID, and cause. Until then, v2 works around it by sharing each rank’s measured time per micro-batch every 10 steps and re-splitting the same global batch so all ranks finish together, the rebalancing that FALCON proposes [2]. GPU 7 runs 4 micro-batches per step and the others run 8–9. Averaged over the throttled periods, step time drops from 1,005 ms in v1 to 623 ms in v2 (1.6×), and throughput rises from 526k to 846k tokens/s.
Zymtrace flags rank 7 in both use cases. The possible causes tell them apart, with a GPU running at 40% of its clock in one and every clock normal in the other.
Correlating GPU stragglers, topology, and continuous profiles
The GPU Stragglers feature says which GPU is holding the job back. GPU topology health says whether the hardware underneath it is sound. Continuous profiling reveals what the code was doing on every GPU and host at that moment. Zymtrace correlates all three by host and time range. Together they cover many of the reliability and performance problems a distributed GPU workload runs into, e.g. a degraded GPU or link, a rank on the wrong NUMA node, an imbalanced data split, or a collective whose bandwidth dropped.
Here is the topology view of the GPU node during a seqlen run. All 28 NVLink pairs were healthy, which matches the straggler pane’s check of 144 NVLink links.
GPUs 1, 2, 3, and 7 logged XID 94 contained memory errors, including GPU 7, the rank that straggled in v1. The straggler disappeared in v2 on the same GPUs, which points to the data split rather than the XID. NVIDIA recommends resetting a GPU after an XID 94 when convenient. The recommendations panel adds a placement problem that no communication metric shows. The /app/seqlen.py ranks ran on CPUs that aren’t local to their GPUs, and each recommendation gives the numactl --cpunodebind command that pins the rank to the right NUMA node.
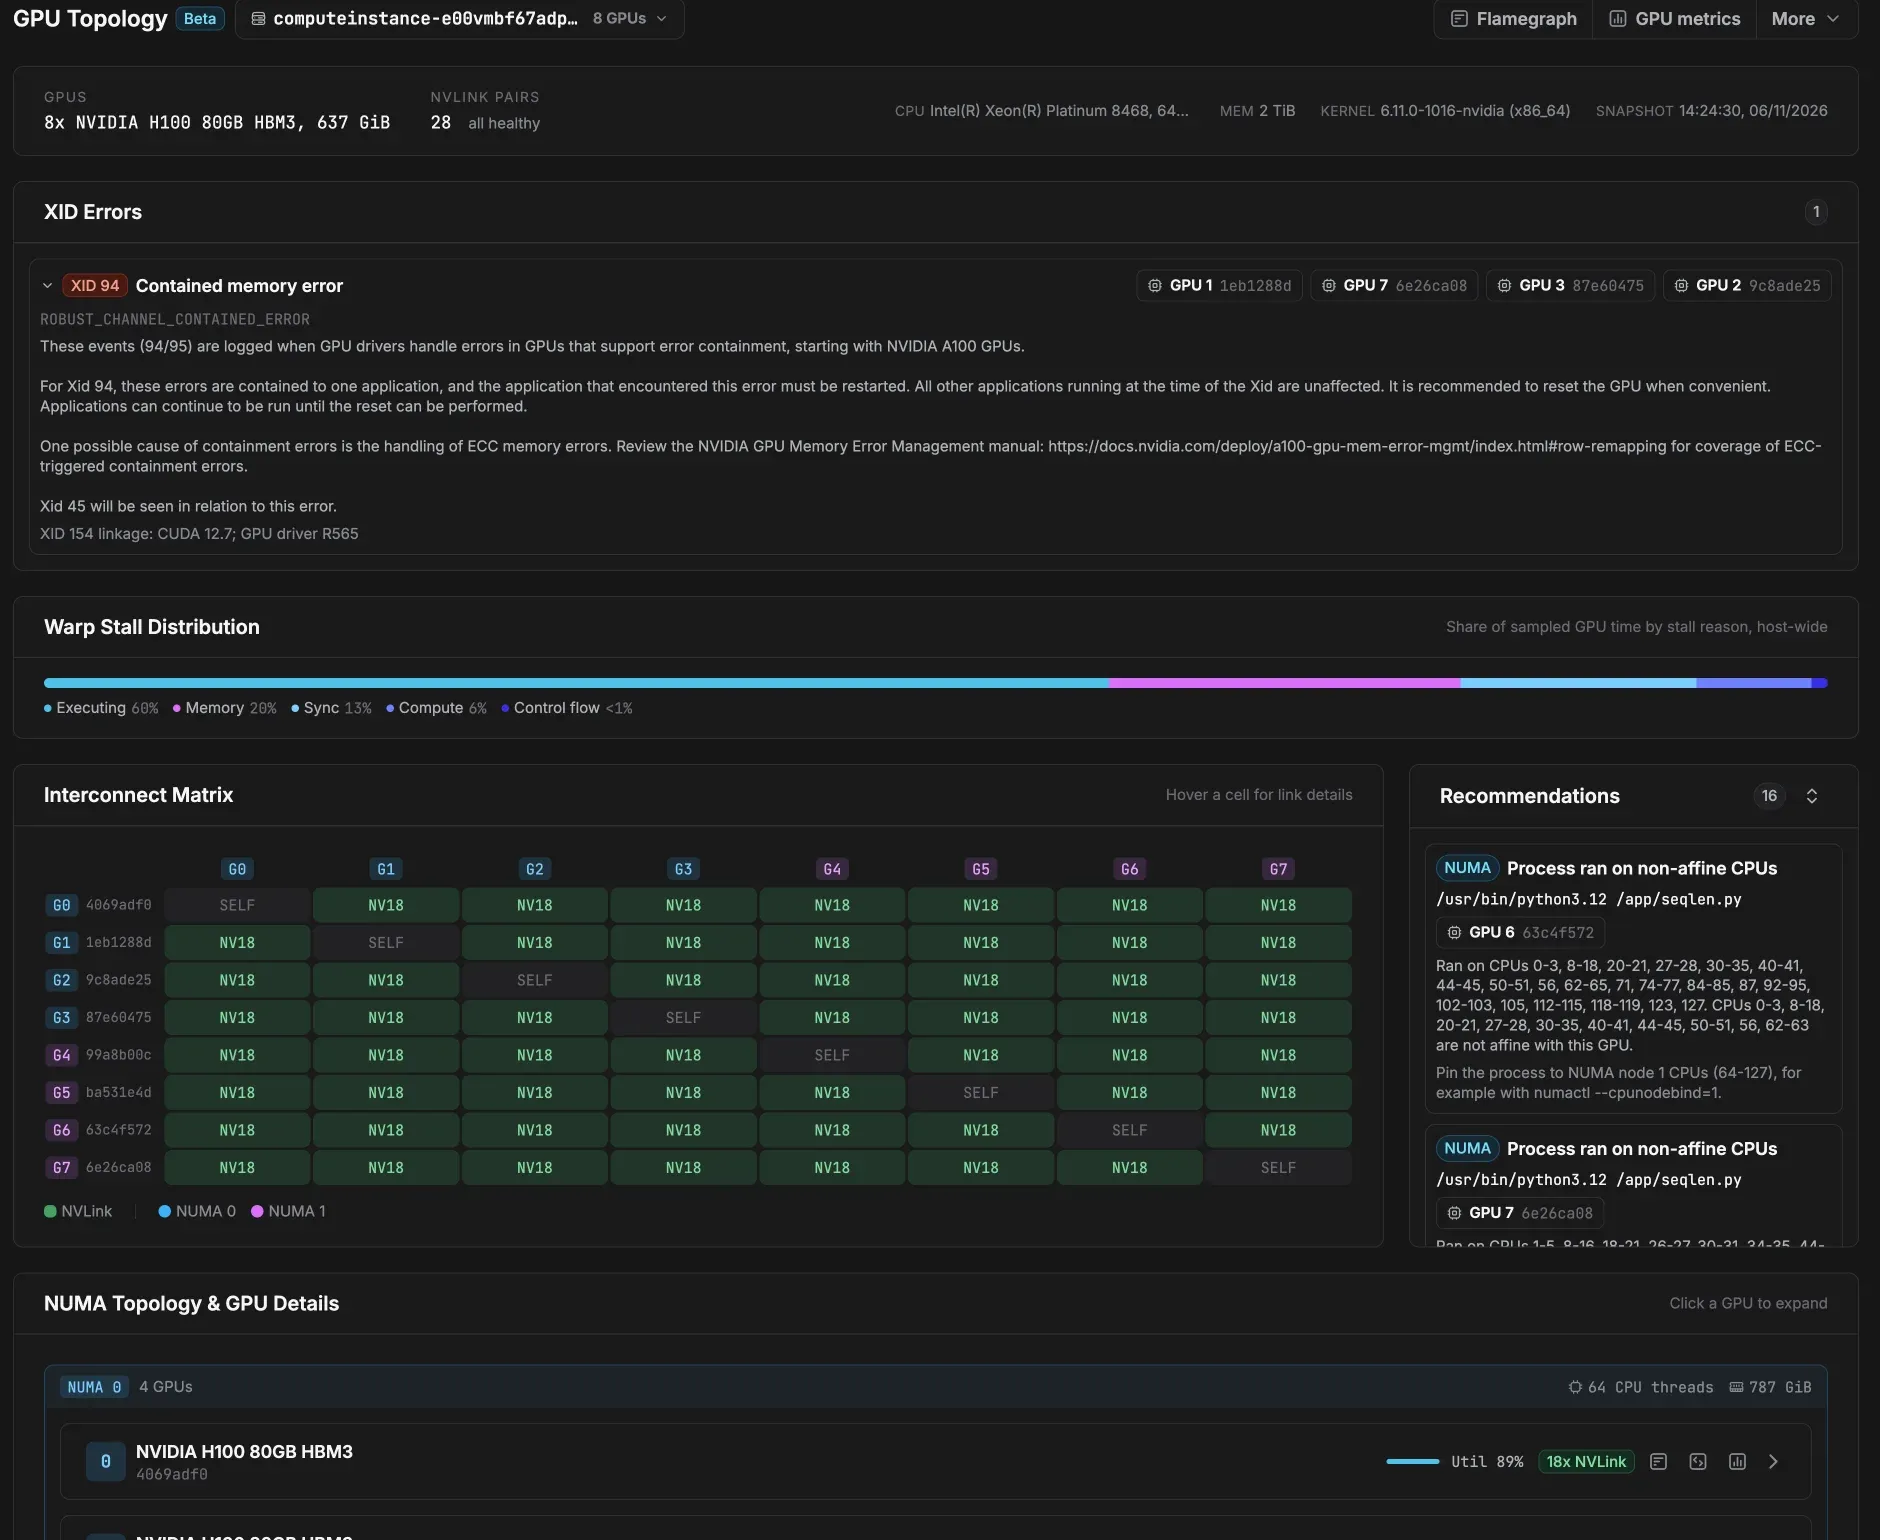
Topology health for the GPU node during a seqlen run.
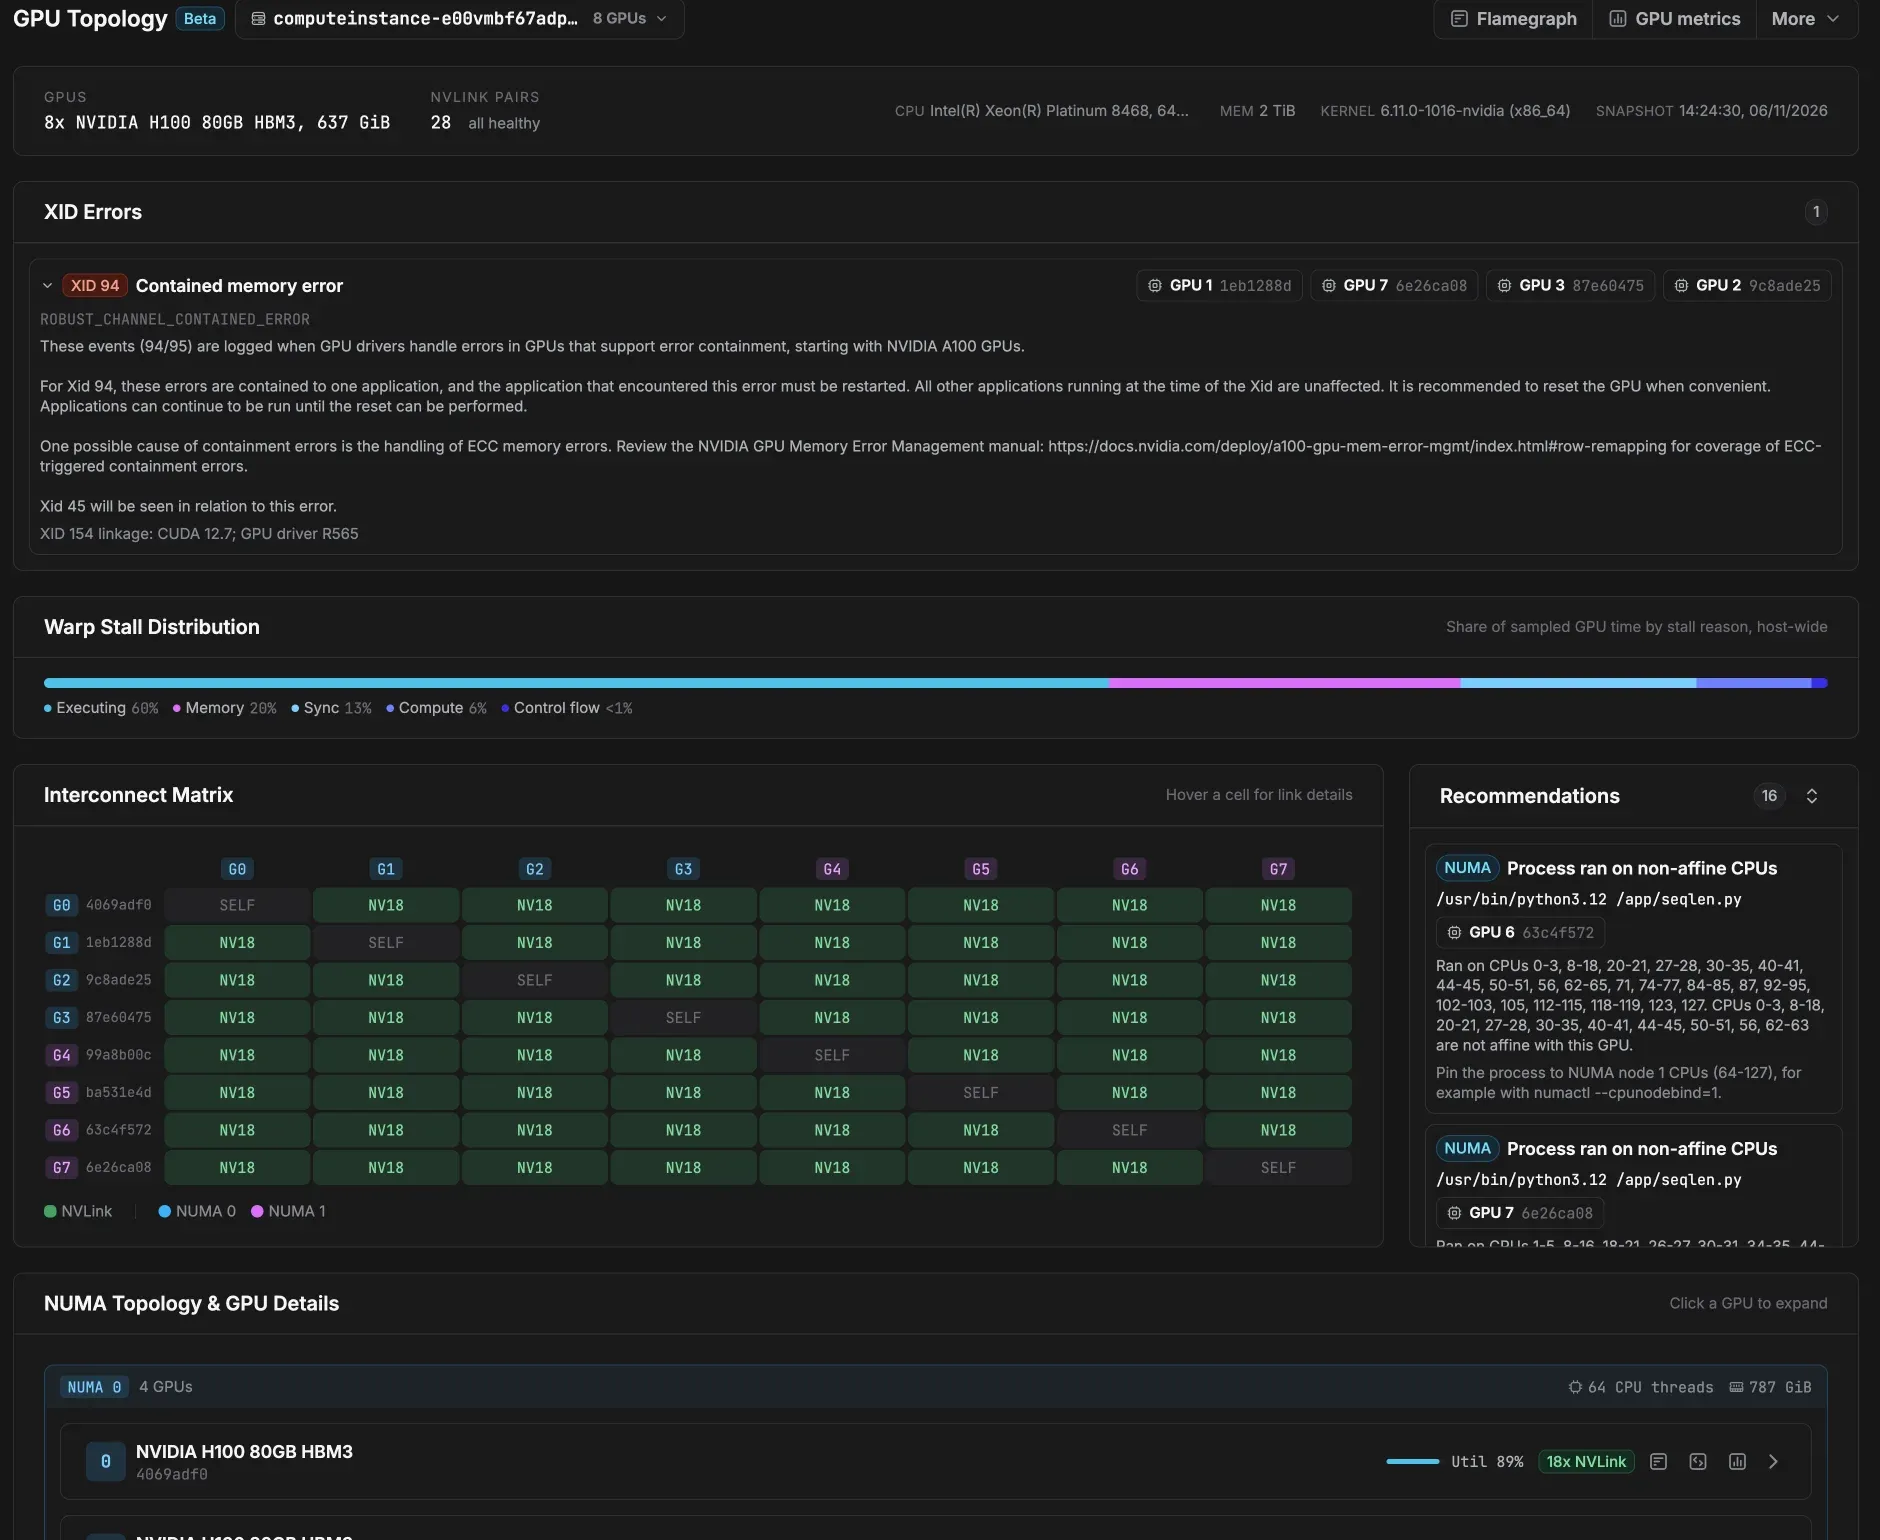
Each layer answered a different part of the seqlen investigation. Zymtrace’s straggler detection found the late rank and per-rank execution times that followed the data split. The hardware checks and topology health found no throttled clocks or NVLink errors. The profiles showed which collective the healthy GPUs were stuck in, and what it cost.
Turning on straggler detection
Straggler detection ships in Zymtrace 26.10.3 and is off by default. Set ZYMTRACE_CUDAPROFILER__NCCL=true on the job, or turn it on in a CUDA profiler rule in the UI. Detection works without CUDA profiling, but the drill-down to code needs the profiler, so run both. Setup for SLURM, Kubernetes, Docker, and bare metal is in the GPU Straggler Detector docs.
References
- Jinkun Lin et al., “Understanding Stragglers in Large Model Training Using What-if Analysis”, OSDI ‘25. New York University and ByteDance.
- Tianyuan Wu et al., “FALCON: Pinpointing and Mitigating Stragglers for Large-Scale Hybrid-Parallel Training”, arXiv:2410.12588. Hong Kong University of Science and Technology and Alibaba Group.
Glossary
- cuDNN: CUDA Deep Neural Network library, NVIDIA’s library of deep learning primitives. It provides one of the attention backends PyTorch can dispatch to.
- DDP: Distributed Data Parallel, PyTorch’s data
parallelism in which every GPU holds a full copy of the model, trains on its
own slice of each batch, and averages gradients with
AllReduceduring the backward pass. - eBPF: Extended Berkeley Packet Filter, a Linux kernel facility for running sandboxed programs in the kernel. Zymtrace uses it to sample CPU stacks without instrumenting the application.
- ECC: Error Correcting Code, memory protection that detects and, when possible, corrects bit errors.
- FSDP: Fully Sharded Data Parallel, data
parallelism in which each GPU stores only a shard of the parameters,
gradients, and optimizer state. Each block’s weights are gathered with
AllGatherbefore it runs, and its gradients are reduced withReduceScatterafter the backward pass. DeepSpeed calls the same approach ZeRO-3. - MCP: Model Context Protocol, an open protocol that lets AI agents call external tools. The Zymtrace MCP server gives coding agents the same profiling and straggler data you see in Zymtrace.
- NCCL: NVIDIA Collective Communications Library, which PyTorch uses for collectives between NVIDIA GPUs.
- NUMA: Non-Uniform Memory Access, where a CPU’s distance to a given memory bank or GPU affects access latency.
- OSDI: USENIX Symposium on Operating Systems Design and Implementation.
- RoCE: RDMA over Converged Ethernet, which carries Remote Direct Memory Access traffic between nodes over Ethernet.
- SASS: Streaming Assembly, NVIDIA’s native GPU instruction set.
- SLURM: Simple Linux Utility for Resource Management, a job scheduler widely used on supercomputers and AI training clusters. Now usually written Slurm.
- SM: Streaming Multiprocessor, the core compute unit on an NVIDIA GPU. The SM clock sets how fast kernels run.
- SXM: NVIDIA’s socketed module form factor for data-center GPUs. On an 8× H100 SXM node, every GPU connects to every other through NVSwitch.
- XID: The NVIDIA driver’s error-reporting mechanism for GPU faults. XID 94 is a contained memory error.


