
Timo von Hartz
9 mins read
•
Introduction
Zymtrace is a low-overhead continuous system-wide CPU and GPU profiling platform, built on the belief that true infrastructure visibility requires understanding every layer of the stack. In response to customer demand for a frictionless, production-suitable way to understand JVM memory behaviour, we have recently added support for allocation profiling for Java (including Zing1-based JVMs), and for remotely setting profiler configuration (including per-process configurations), all without any restarts of the profiler or target application.
Allocation profiling tracks memory allocation events to identify which code paths are responsible for heap pressure, excessive GC activity, or memory bloat. Traditional approaches rely on library injection into target processes, instrumentation that carries significant overhead, and configuration changes that require application restarts, making them impractical for continuous use in production environments. Unlike these approaches, Zymtrace’s implementation is built on eBPF, delivering significantly lower overhead and requiring no library injection or changes to target processes, making it frictionless to deploy across your entire infrastructure.
In this blog post, we’ll showcase the new features, then do a deep dive on the technical details of how allocations work in Java, how allocation profiling is implemented in Zymtrace and in async-profiler (an alternative, very popular sampling profiler for Java), and will compare their differences and strengths.
Showcase of Allocation Profiling in Zymtrace
In the above video, we can see a demonstration of the on-demand allocation
profiling that we support for Java. We have our profiler and a Java benchmark
running on the machine, which initially does not output allocation profiles.
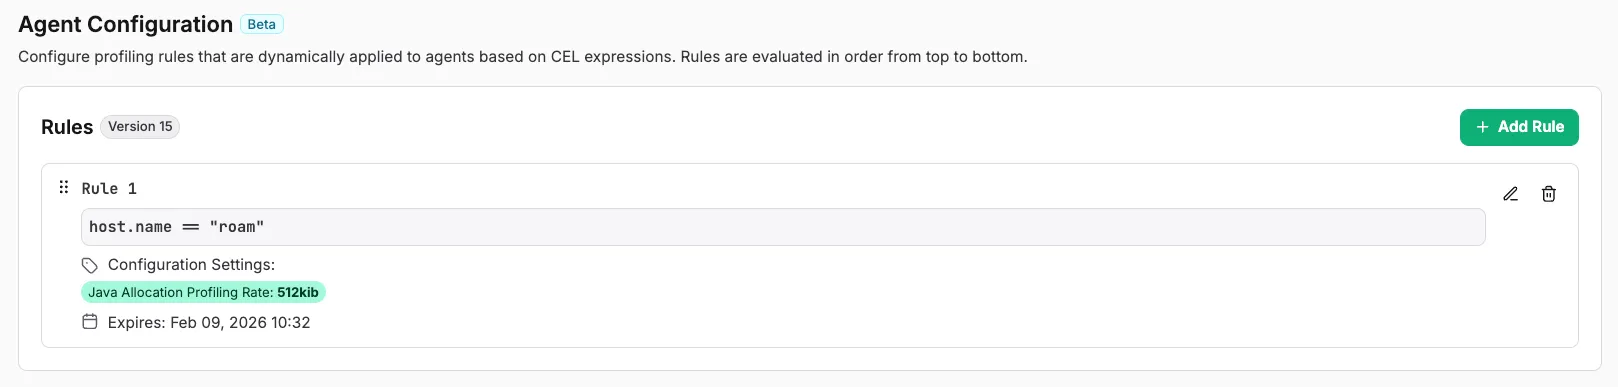
Then, in our UI, we configure the profiler to sample allocations at 512KiB
intervals, and to do that for 5 minutes at most.
We immediately see allocation profiles, containing the classes that were allocated, their total allocation size, and the stack trace that caused the allocation to show up in our flamegraph - and in all other places you’d expect them, e.g., in top functions.
We then manually delete the rule, and the profiler immediately stops profiling Java allocations. All of this happens without any restarts to the profiler, or the target application - and across your whole cluster, if you want it. You can add various filters to only target specific processes, containers, hosts, or any other filter that we support in our query bar.
Allocations in Java
Each thread in Java has a Thread Local Allocation Buffer (TLAB), from which allocation requests are attempted first. This is a simple arena, with bump allocation. It contains an end pointer, and a current pointer, and as long as there is space, it can simply bump the current pointer to serve the allocation.
When a TLAB runs out of space, the JVM falls back to the slow allocation path, which most of the time requires allocating a new TLAB, and serving the request from there. Big allocations (which would never fit in the TLAB), are always allocated from the slow path, and don’t cause allocation of a new TLAB.
The TLAB pointer bumps are inlined into all JIT compiled Java methods, which poses some challenges for profiling them. Approaches such as rewriting the bytecode / jitted functions are prohibitively expensive, and only profiling on the slow path misses the full picture.
That’s why Java introduced a low-overhead way to sample Heap allocations. It’s accessed and configured via JVMTI (which requires loading an “agent”, a dynamic library into the process). When enabled, it artificially sets a lower end pointer for the TLAB, to cause allocations to exit the JITted code path, and fall back to the slow path earlier than they normally would. On the slow path, decisions such as whether we want to take a sample can then be taken.
Note that the JVM picks these fake end pointer smartly: it does not simply set them to the requested sampling rate, which could lead to biased views of allocations that always follow the same pattern. Instead, a geometric mean based on the sampling interval is chosen, to avoid this bias.
While other JVM implementations (such as Zing) are not open source, we’ve verified (through reverse engineering), that they essentially follow a similar pattern.
async-profiler’s Implementation of Allocation Profiling
We’ve studied the source code, and used it as a comparison while developing our approach to Java allocation profiling. async-profiler uses JVMTI when available, loads a library into the target process, and configures allocation sampling (when requested). This was initially introduced in this commit.
It records the instance_size (size of the class being allocated), as well
as the total_size (number of bytes that were allocated since the last sample
was taken). The total_size is a useful metric, because by taking it, your
overall allocation numbers correctly add up to the bytes actually allocated by
the JVM, even though you’re sampling.
However, the JVMTI events don’t contain this information, so async-profiler
simply estimates it based on the configured sampling interval. While this would
be correct if the heap sampling in JVM simply reset the pointers according to
the specified interval, this is not the case. As shown above, the JVM uses
geometric means to pick the next sample point - and that can diverge from the
configured sampling interval. This means that the total_size reported can’t
be correct (and is an over-estimate of the actual size), as async-profiler is
missing information to correctly report it.
Zymtrace’s Implementation of Allocation Profiling
Zymtrace uses the code that is backing JVMTI allocation profiling, but it does not use this through the JVMTI interface. There are two reasons for this:
- loading a library into the target process is annoying, especially in today’s containerized world. You need to make sure the library is accessible to every container, or jump through hoops to load it.
- the JVMTI events are missing information that is needed to correctly
calculate the
total_sizeof allocations, as mentioned above.
However, we’d still very much like to benefit from being able to profile and
sample allocations being performed on JIT compiled code. Thus, we place eBPF
uprobes on appropriate places (namely, in the ThreadHeapSampler that is
backing the JVMTI interface), which allow us to capture more information than
what is included in the JVMTI events. Additionally, this does not require us to
load a library into the target process, as we’re using eBPF for taking samples
and stack traces.
Comparison
In this section, we’ll compare the two approaches. While async-profiler is a tool/library for profiling Java applications, zymtrace is a complete profiling solution. Zymtrace contains a backend for storing profiling events, that scales to hundreds of thousands of unique hosts. It contains an advanced flamegraph renderer, supports profiling languages other than Java, includes in-depth metrics, and GPU profiling. It’s designed to easily scale and be deployed on your whole cluster, with minimal impact on performance.
We handle setup for you - you don’t need to figure out how to build and ship async-profiler, or get containers to be able to load the library (or get data back out from it). As shown in the video, we provide an easy to use UI to configure profiler settings on demand, and scope them to specific hosts, processes, or only enable them from a specific time duration:

zymtrace profiler configuration UI
Both async-profiler and zymtrace’s implementation of allocation profiling slow down applications slightly. We’ve ran a reasonably allocation intensive benchmark from the Renaissance suite for comparision. In our tests, the application slowdown incurred by zymtrace’s allocation profiling is ~1.5%, while async-profiler adds ~7%.
Benchmarks
- All tests ran using
hyperfinewith 10 iterations for stability - CPU boosting disabled for consistent results
$ ./zing25.02.0.0-2-jdk21.0.6-linux_x64/bin/java \
  -jar ~/doc/java_bench/renaissance-gpl-0.16.0.jar scrabble
No allocation profiling at all
Time (mean ± σ):     11.406 s ±  0.337 s    [User: 118.999 s, System: 4.901 s]
Range (min … max):   11.070 s … 12.000 s    10 runs
Zymtrace alloc profiling (16MiB sampling rate)
Time (mean ± σ):     11.573 s ±  0.246 s    [User: 121.166 s, System: 5.159 s]
Range (min … max):   11.284 s … 12.066 s    10 runs
async-profiler alloc profiling (16MiB sampling rate)
Time (mean ± σ):     12.207 s ±  0.015 s    [User: 125.692 s, System: 5.364 s]
Range (min … max):   12.193 s … 12.244 s    10 runs
Conclusion
Allocation profiling is a powerful technique for understanding memory usage patterns in Java applications. While tools like async-profiler provide a solid foundation, Zymtrace’s eBPF-based approach offers several advantages: lower overhead (~1.5% vs ~7%), more accurate allocation metrics, and seamless deployment without requiring library injection into target processes.
Most importantly, Zymtrace provides a complete profiling solution that scales across your entire infrastructure with an intuitive UI for on-demand configuration. Whether you’re troubleshooting memory issues in production or optimizing allocation patterns during development, Zymtrace makes it easy to get the insights you need.
Get started with Zymtrace today at no cost!
Footnotes
-
Azul and Zing are either registered trademarks or trademarks of Azul Systems Inc., registered in the U.S. and elsewhere. All other trademarks belong to their respective owners. ↩