GPU Profiling
Identify performance bottlenecks in CUDA kernels, optimize inference batch size, and eliminate idle GPU cycles with zero friction. Get deep cluster-wide visibility into CPU⇄GPU interactions that traditional tools miss.
Do more with fewer GPUs
Supported AI/ML Platforms
zymtrace works seamlessly with your existing GPU and ML infrastructure across all major frameworks
Maximize GPU Efficiency
Debug performance issues faster and do more with fewer GPUs
Underutilized GPUs lead to longer training cycles, costly inference, and wasted energy. zymtrace pinpoints inefficiencies by profiling CUDA kernels, disassembling SASS mnemonics, exposing GPU stall reasons, and correlating them back to the CPU traces that launched them.

Optimize CUDA Kernels
Identify kernel fusion opportunities and eliminate redundant operations. 300% speed-ups possible.
Kernel Launch Analysis
Find Optimal Batch Size
Discover the "Sweet Spot" between memory-bound and compute-bound performance.
Inference Batch Optimization
Fix GPU Utilization
Detect GPU stalls and CPU bottlenecks with end-to-end visibility across your pipeline.
Stall Reason Analysis
Detect Performance Patterns
Start with monitoring, then drill down into detailed profiles.
Real-Time GPU MonitoringCut Inference Costs
Inference runs 24/7 in production—small inefficiencies become massive costs. Find the optimal batch size, eliminate GPU stalls, and maximize throughput per dollar by optimizing your inference pipelines on both CPU and GPU.
Supported Inference Engines
vLLM
Ollama

llama.cpp

SGLang
+ Any CUDA-enabled application, including Python frameworks that use CUDA
How the zymtrace GPU profiler works
Built from the ground-up as a continuous profiler for heterogeneous workloads. Correlates CPU and GPU execution across your entire cluster, providing unified visibility into distributed workloads.

zymtrace GPU profiler architecture
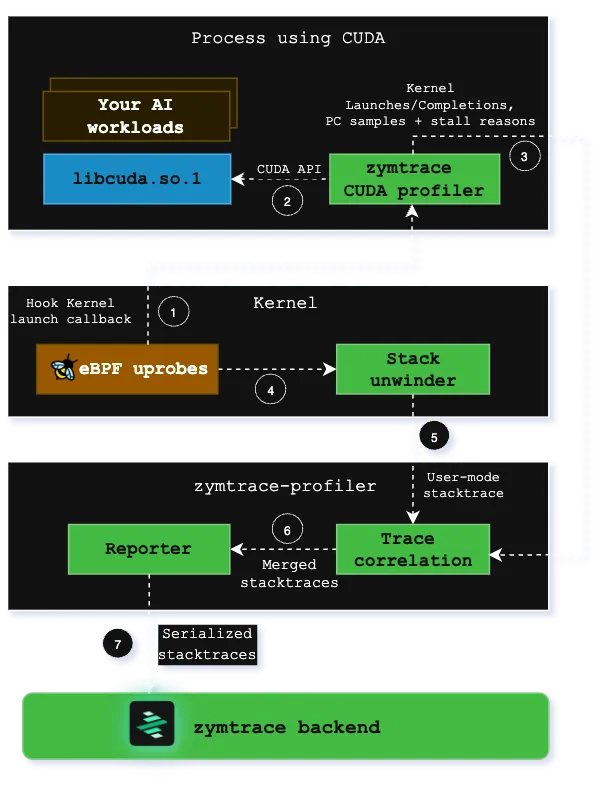
Launch your CUDA application
Launch your CUDA-enabled AI workloads with the zymtrace GPU profiler enabled. No code changes required
eBPF-Based Profiling
The zymtrace profiler detects CUDA launches and places uprobes on exported functions. These uprobes invoke CPU stack unwinders using the same eBPF technology that powers our CPU profiling, capturing the complete call stack from user code to kernel launch.
GPU Instruction Sampling
Our CUDA profiler samples high-granularity information about GPU instructions (SASS) running on compute cores and identifies stall reasons that prevent kernels from making progress. This data reveals exactly why kernels are slow at the microarchitectural level.
Unified Stack Trace Generation
Stack traces from Host and GPU execution data are merged in the zymtrace profiler, creating unified traces that span from user-mode PyTorch/JAX code through CUDA runtime down to individual GPU instructions and stall reasons. These are visualized as interactive flamegraphs in our UI.
Compliant
zymtrace is OpenTelemetry compliant, including support for OTEL resource attributes. Collect, process, and export profiling data in the standard OpenTelemetry format for seamless integration with your existing observability stack.
The zymtrace team were part of the team that pioneered, open-sourced, and donated the eBPF profiler to OpenTelemetry. With zymtrace, we're extending that same low-level engineering excellence to GPU-bound workloads and building a highly scalable profiling platform purpose-built for today's distributed, heterogeneous environments — spanning both general-purpose and AI-accelerated workloads.
FAQ
Frequently Asked Questions
Ready to Optimize Your GPU Workloads?
Get started with GPU profiling in minutes and unlock the full potential of your hardware.
Start Free Trial