
Israel Ogbole
14 mins read
•
BLUF: Nsight was built for short, controlled runs in lab environments. Nsight Systems doesn’t officially support profiling runs longer than five minutes and Nsight Compute adds 20-200× overhead that makes extended sessions impractical. zymtrace (leverages eBPF) to deliver frictionless continuous, low-overhead GPU profiling that exposes transient and hard-to-reproduce performance issues that single snapshots miss. It helps you debug faster, eliminate waste, and maximize throughput per GPU, per watt, per dollar.
Use Nsight if you’re developing a CUDA kernel running on a single GPU. Use zymtrace if you need actionable cluster-wide GPU visibility correlated with CPU stacktraces in production. If you’re working on models large enough that they can’t fit into one GPU, zymtrace is most certainly for you.
The Pain
If you’ve ever tried to debug or optimize a GPU workload at scale, you know the pain.
You SSH into a machine, pull down gigabytes of .ncu-rep and .nsys-rep files, and manually stitch together what’s happening across hundreds of GPUs, one at a time. Then you bounce between Nsight Systems and Nsight Compute, two separate tools with different interfaces, file formats, and workflows. One shows timelines. The other dives into kernels. Neither gives you the full picture.
It’s like searching for one needle in a million haystacks while switching between two magnifying glasses.
That’s the Nsight experience. Nsight helps you tune CUDA kernels in isolation. zymtrace helps you understand performance at the cluster level, in production, where it really matters: continuously, at scale, and across the full heterogeneous stack.
Why Nsight Can’t Scale to Production
Nsight Compute and Nsight Systems are good tools for sandbox environments. They provide deep hardware visibility when writing CUDA kernels on a single GPU and can quickly reveal whether a workload is compute- or memory-bound. However, they face significant limitations in distributed settings: they don’t scale to GPU clusters, and since most modern models can’t fit on a single GPU, these tools become impractical for both multi-node training and production inference deployments.
The 5-Minute Ceiling
Nsight Systems does not officially support runs longer than 5 minutes.
— NVIDIA Nsight Systems Documentation (source).
That’s not just a recommendation. That’s a hard limit. Large result files take extremely long to load, run out of memory, or lock up entirely. Meanwhile, Nsight Compute adds 20–200× runtime overhead from its kernel replay architecture, making extended sessions impractical.
Real production workloads don’t run for five minutes. They run for hours or days. And everything that matters happens in that extended window:
- Performance drift that accumulates over time—data loader inefficiency, growing sync delays, memory fragmentation
- Thermal throttling that changes kernel timing after sustained load
- Intermittent failures from fail-slow nodes, race conditions, and data-dependent edge cases
- Dynamic workloads where libraries, frameworks, and batch sizes shift mid-run
- Statistical significance from capturing multiple iterations instead of a single potentially unrepresentative sample
Fragmented Tooling
Nsight forces you to context-switch constantly. The recommended flow is: start with Nsight Systems for application-level behavior, identify bottleneck kernels, then switch to Nsight Compute for detailed analysis. Different GUIs. Different workflows. You never see the complete picture in one place.
Now scale that to a distributed training job across 100 GPUs and 50 nodes. You’d need to SSH into every machine, run profilers individually, collect massive trace files, manually correlate timestamps across nodes, and piece together what’s happening while your job grinds to a halt.
No continuous visibility. No cluster view. No historical performance data.
Nsight is built for the sandbox. Not for production.
What zymtrace Does Differently
zymtrace was engineered from first principles to profile GPUs without friction, applying the same low-level system engineering excellence that made the now OTel eBPF CPU Profiler the industry standard. We were part of the team that open-sourced and donated the eBPF profiler to OpenTelemetry.
Our mission for zymtrace is simple but bold: Unlike anything else available, zymtrace GPU profiler builds stack traces—from high-level PyTorch ops and user-space libraries through native code and CUDA kernels, all the way down to the Linux kernel. We go even deeper, capturing GPU instruction mnemonics, GPU stall reasons, and memory offsets, and correlating them back to the exact CUDA kernel function that triggered the execution, unearthing microarchitectural inefficiencies in AI workloads.
Always-On, Cluster-Wide GPU Profiling
Deploy zymtrace once and get continuous visibility across every GPU, process, and kernel. No code changes. No manual instrumentation. No per-node SSH sessions. zymtrace uses eBPF extensively.
You certainly don’t need a PhD in GPU architecture to make sense of the data. zymtrace surfaces actionable insights in a unified WASM-powered interface that makes bottlenecks obvious, whether you’re debugging a training run or optimizing inference latency.
Refer to zymtrace architecture.
Heterogeneous CPU + GPU Profiling
Here’s what truly sets zymtrace apart: it captures CPU and GPU activity simultaneously and automatically correlates GPU stalls back to the exact CPU stack trace that launched the CUDA kernel.
GPUs don’t run in isolation. Most “GPU problems” are actually CPU bottlenecks, and you can’t fix what you can’t see.

Idle GPU cycles
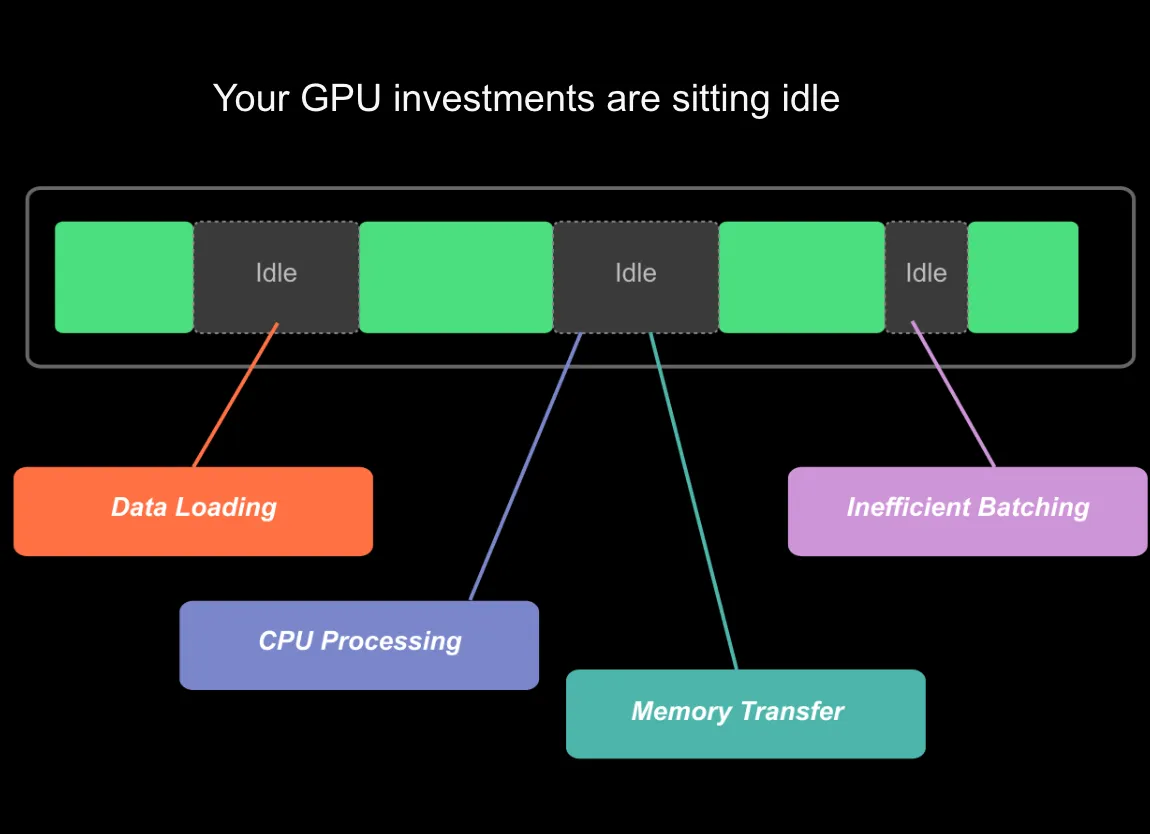
In a typical training loop, green blocks show active GPU compute. Gray “Idle” sections reveal wasted cycles:
- Data loading: CPU-bound preprocessing holding up execution
- CPU processing: Batch preparation taking too long
- Memory transfers: PCIe bandwidth saturation between host and device
- Poor batching: Undersized batches leaving compute capacity unused
Without heterogeneous profiling, you’d see the idle time but have no idea why. With zymtrace, you see the exact CPU code path correlated to CUDA kernels, CUDA SASS mnemonics, down to the GPU memory address.
Metrics + Profiles, Correlated
zymtrace doesn’t just profile. It collects GPU performance metrics and correlates them to profiles. Spot a drop in power utilization? Drill down to the corresponding profile and see the exact lines of code causing the issue. (NVIDIA’s GPU utilization metric is notoriously misleading—power draw tells the real story.)
Most GPU performance problems aren’t GPU problems at all. They’re data pipeline bottlenecks, CPU preprocessing delays, or memory transfer saturation. zymtrace reveals these hidden inefficiencies in a single, unified interface.
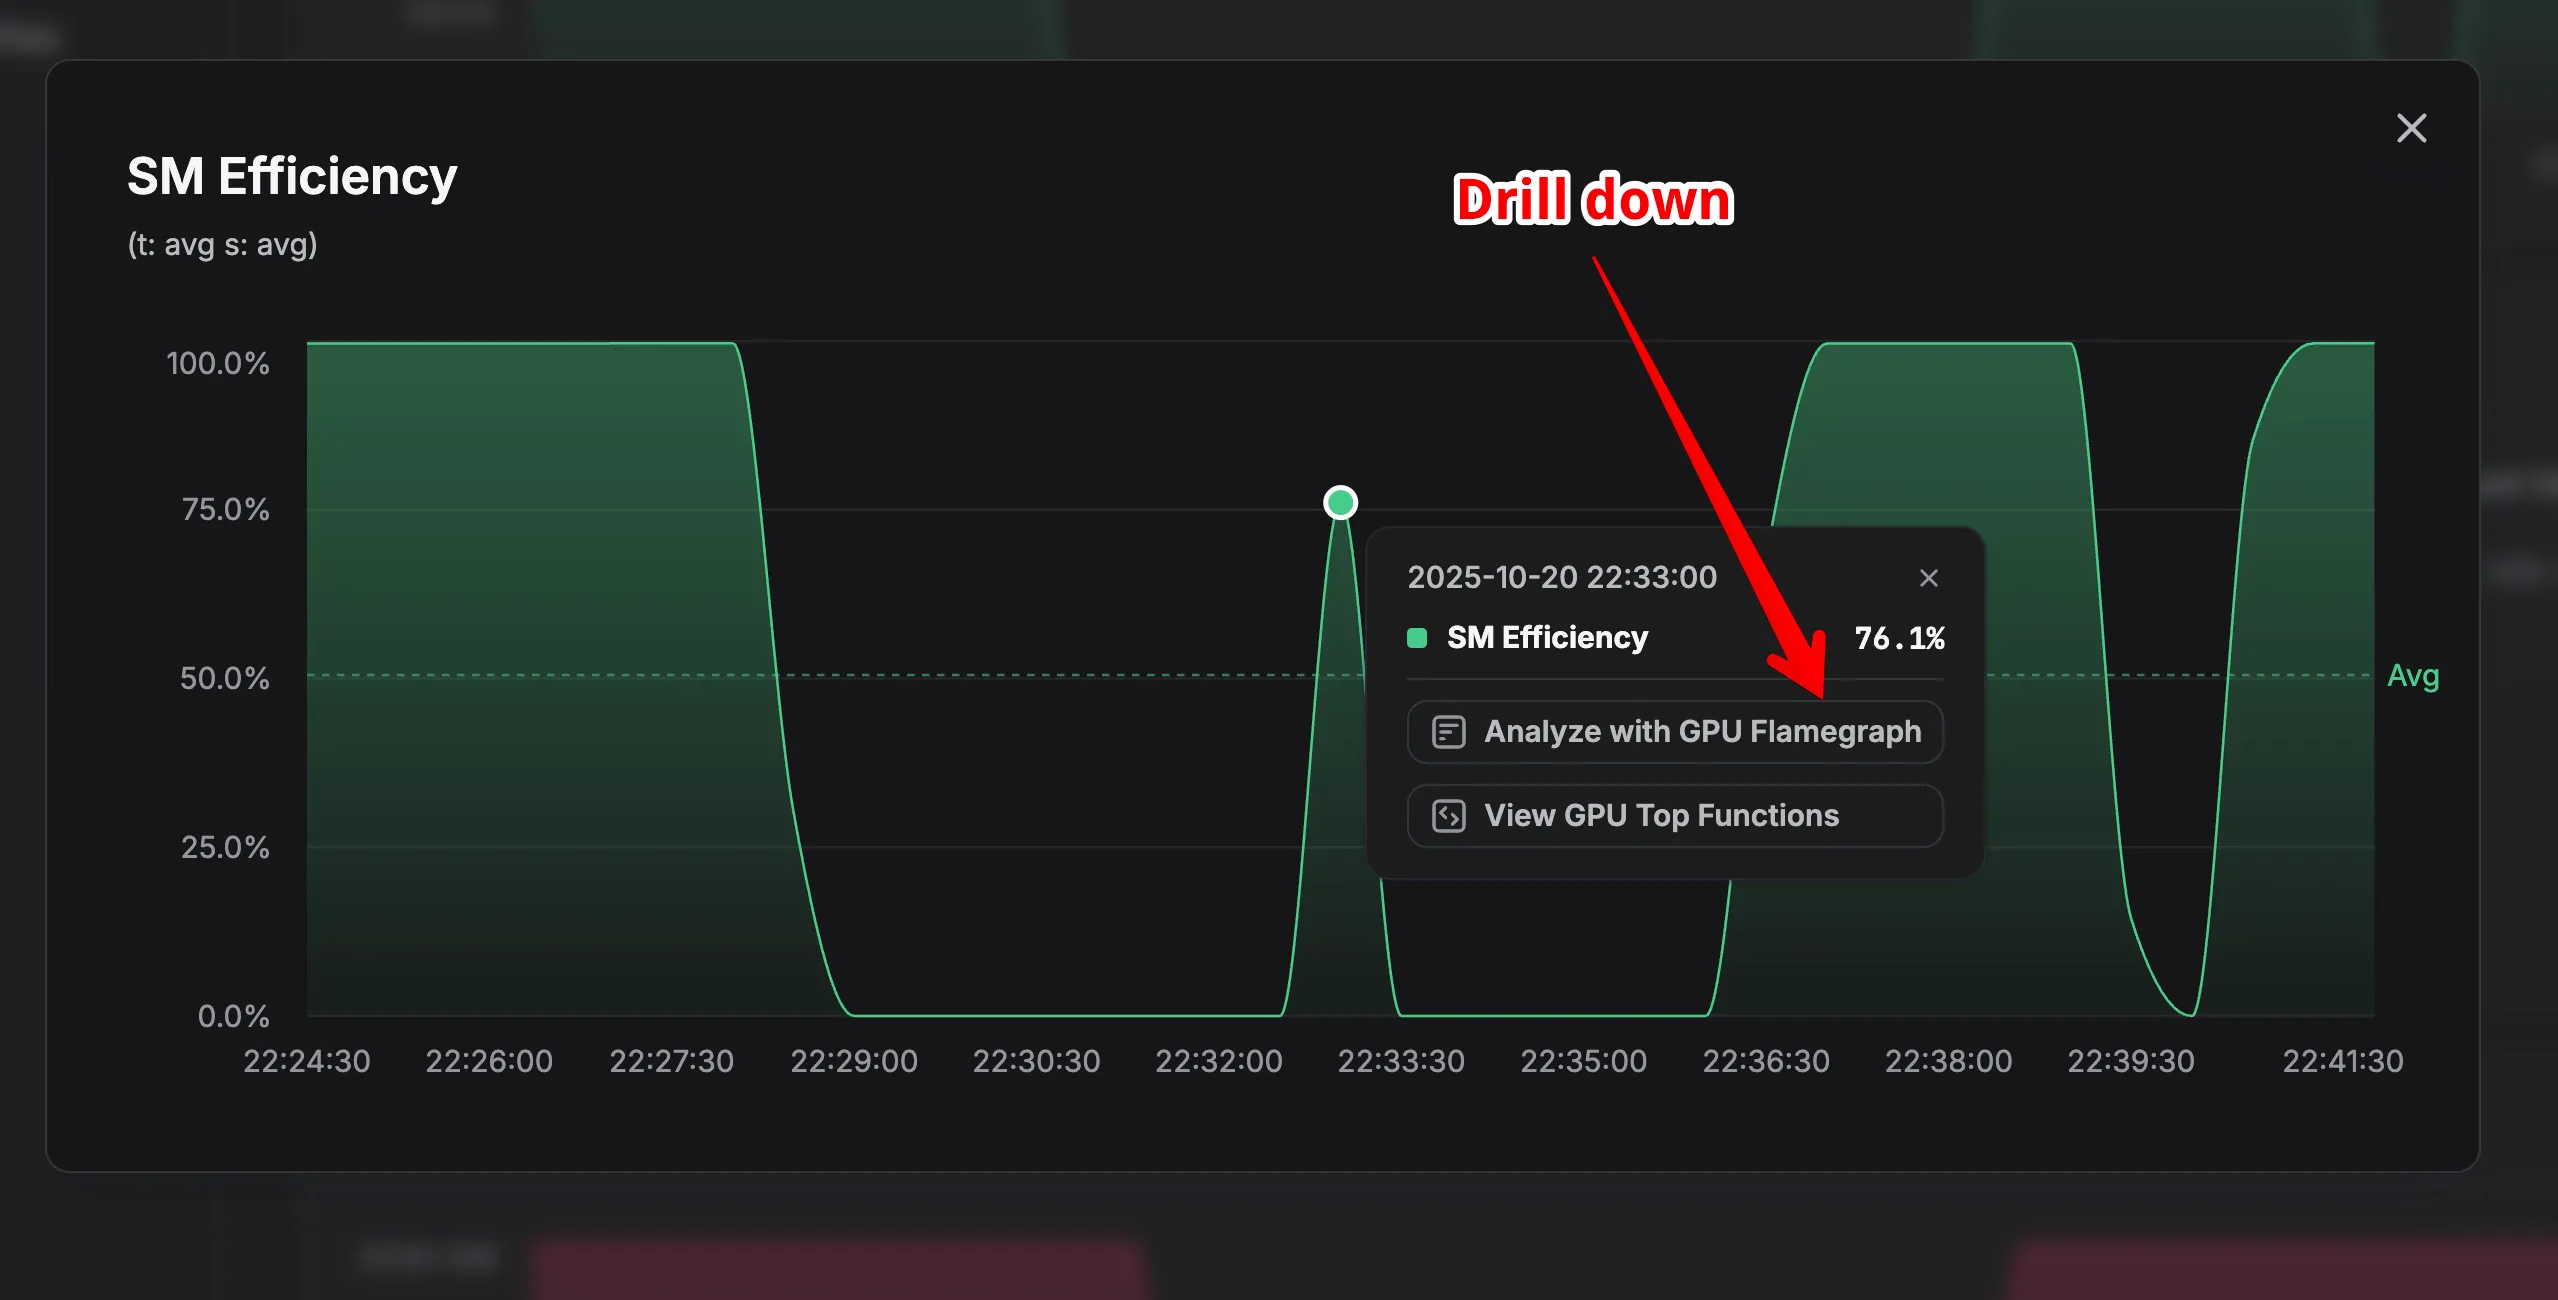
SM Efficiency Metrics

Production Optimization at Scale
Development is not production. Debugging and optimizing GPU workloads in production requires different tools than tuning kernels in a sandbox.
Nsight’s five-minute profiling limit and fragmented toolset make it impossible to capture the complexity, concurrency, and entropy of real-world distributed workloads. zymtrace was built for this: continuous, cluster-wide visibility that reveals intermittent and hard-to-reproduce performance issues that static snapshots miss.
Our goal is simple: help you maximize throughput per GPU, per watt, per dollar. You can’t optimize what you can’t measure, and zymtrace shows exactly where GPU cycles are wasted across your entire cluster—so you can make capacity decisions based on data, not guesswork.
The Difference at a Glance
| Nsight Compute / Systems | zymtrace | |
|---|---|---|
| Runtime overhead | 20–200× (Compute) | ~ 1 logical core, ~314 MB (ref ) |
| Max profiling duration | 5 minutes (Systems) | Always-on |
| Cluster visibility | None—manual per-node collection | Native cluster-wide view |
| CPU + GPU correlation | Limited | Full heterogeneous profiling, leveraging eBPF |
| Interface | Two separate desktop GUIs | Modern unified web interface, with MCP server integration |
| Historical tracking | None | Continuous with regression detection |
| Best for | Single-GPU kernel dev | Production clustered-GPU workloads |
Sounds Interesting?
Get started today at no cost!. You can host zymtrace wherever you want — we provide both Helm charts and Docker Compose configs. If you’re familiar with either, you can have it running within 5 minutes.
Once deployed, the profiling agent automatically profiles everything running on your machines with virtually no overhead. No configuration changes, no instrumentation required. Just run it and watch profiles for all running applications appear in our UI!
For CPU profiling, we support all major languages out of the box — both high-level languages that would otherwise require specialized profilers (Python, Java, Kotlin, Node.js, PHP, Ruby, .NET, and more) and native languages like C/C++, Rust, and Go.
For GPU workloads, we support everything that is built on top of CUDA. This also includes frameworks like PyTorch and JAX.


