Product
Introducing zymtrace, world’s first distributed profiler for GPU & CPU workloads

Israel Ogbole
Joel Höner
6 mins read
•
Imagine this 👉🏼: Your AI infrastructure is scaling to meet growing demands, but hidden inefficiencies are driving up costs, degrading performance, and slowing innovation. Traditional profiling tools leave you in the dark, unable to diagnose the interactions between CPUs and GPUs that power your workloads. Meanwhile, the pressure to optimize—both financially and sustainably—is mounting.
At zystem.io, we’ve lived this challenge. We understand the frustration of chasing elusive bottlenecks and the growing need for solutions that go beyond surface-level metrics and traces. That’s why today, we’re thrilled to introduce zymtrace, the world’s first distributed profiler engineered specifically for general-purpose and AI accelerated workloads.
zymtrace revolutionizes how engineers can optimize their modern infrastructure by:
- Providing unified visibility across GPU and CPU workloads, from inference to AI agents to general applications
- Translating complex performance data into clear, actionable recommendations that guide your optimization efforts
- Making advanced performance optimization accessible to every engineer, not just hardware specialists
- Enabling zero-friction observability powered by eBPF—no code changes, no restarts, no instrumentation required
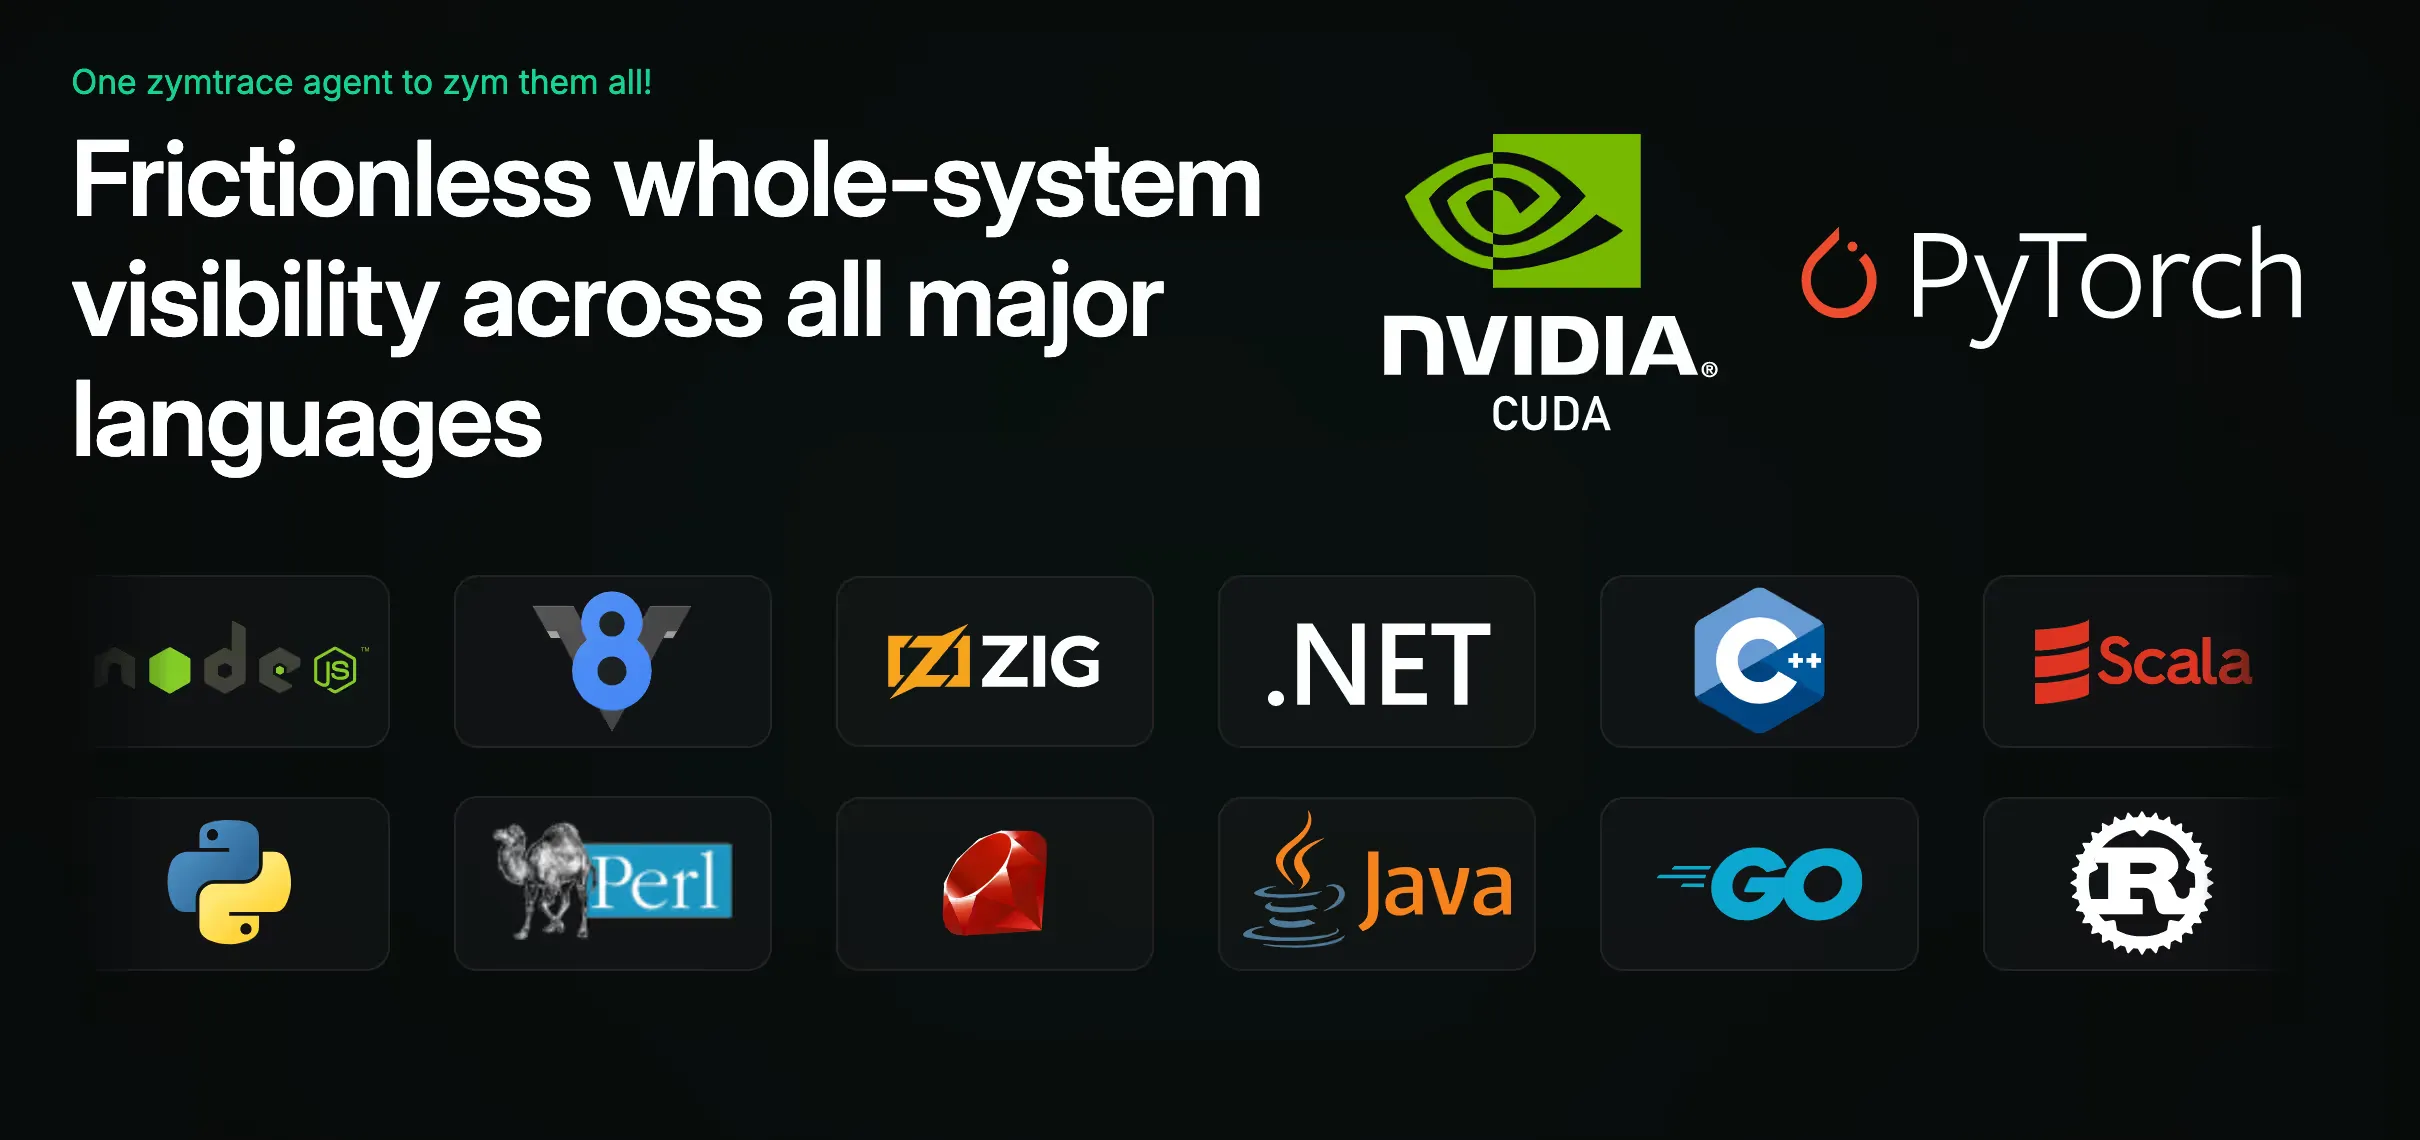
Drop our agent in and watch it monitor every single line of code running on the system, regardless of whether it’s your own code or third-party applications, whether it’s written in an interpreted language or a native one, whether it’s running on CPU or GPU. If your machine is spending precious cycles on it, we make it visible.
Traditional profilers throw flamegraphs at you and expect you to decode them. zymtrace tells you exactly what’s happening and shows you precisely what to do about it.
A New Era of Compute: Heterogeneous Workloads
The computing landscape is undergoing a profound transformation. Infrastructure is becoming increasingly heterogeneous, spanning CPUs, GPUs, and specialized AI accelerators distributed across data centers and cloud platforms. Organizations across industries—research labs, e-commerce, finance, and beyond—are distilling their own models, running inference at scale, and developing advanced AI agents to harness internal data, all while navigating the complexities of performance and cost optimization.

zymtrace AI Flamegraph
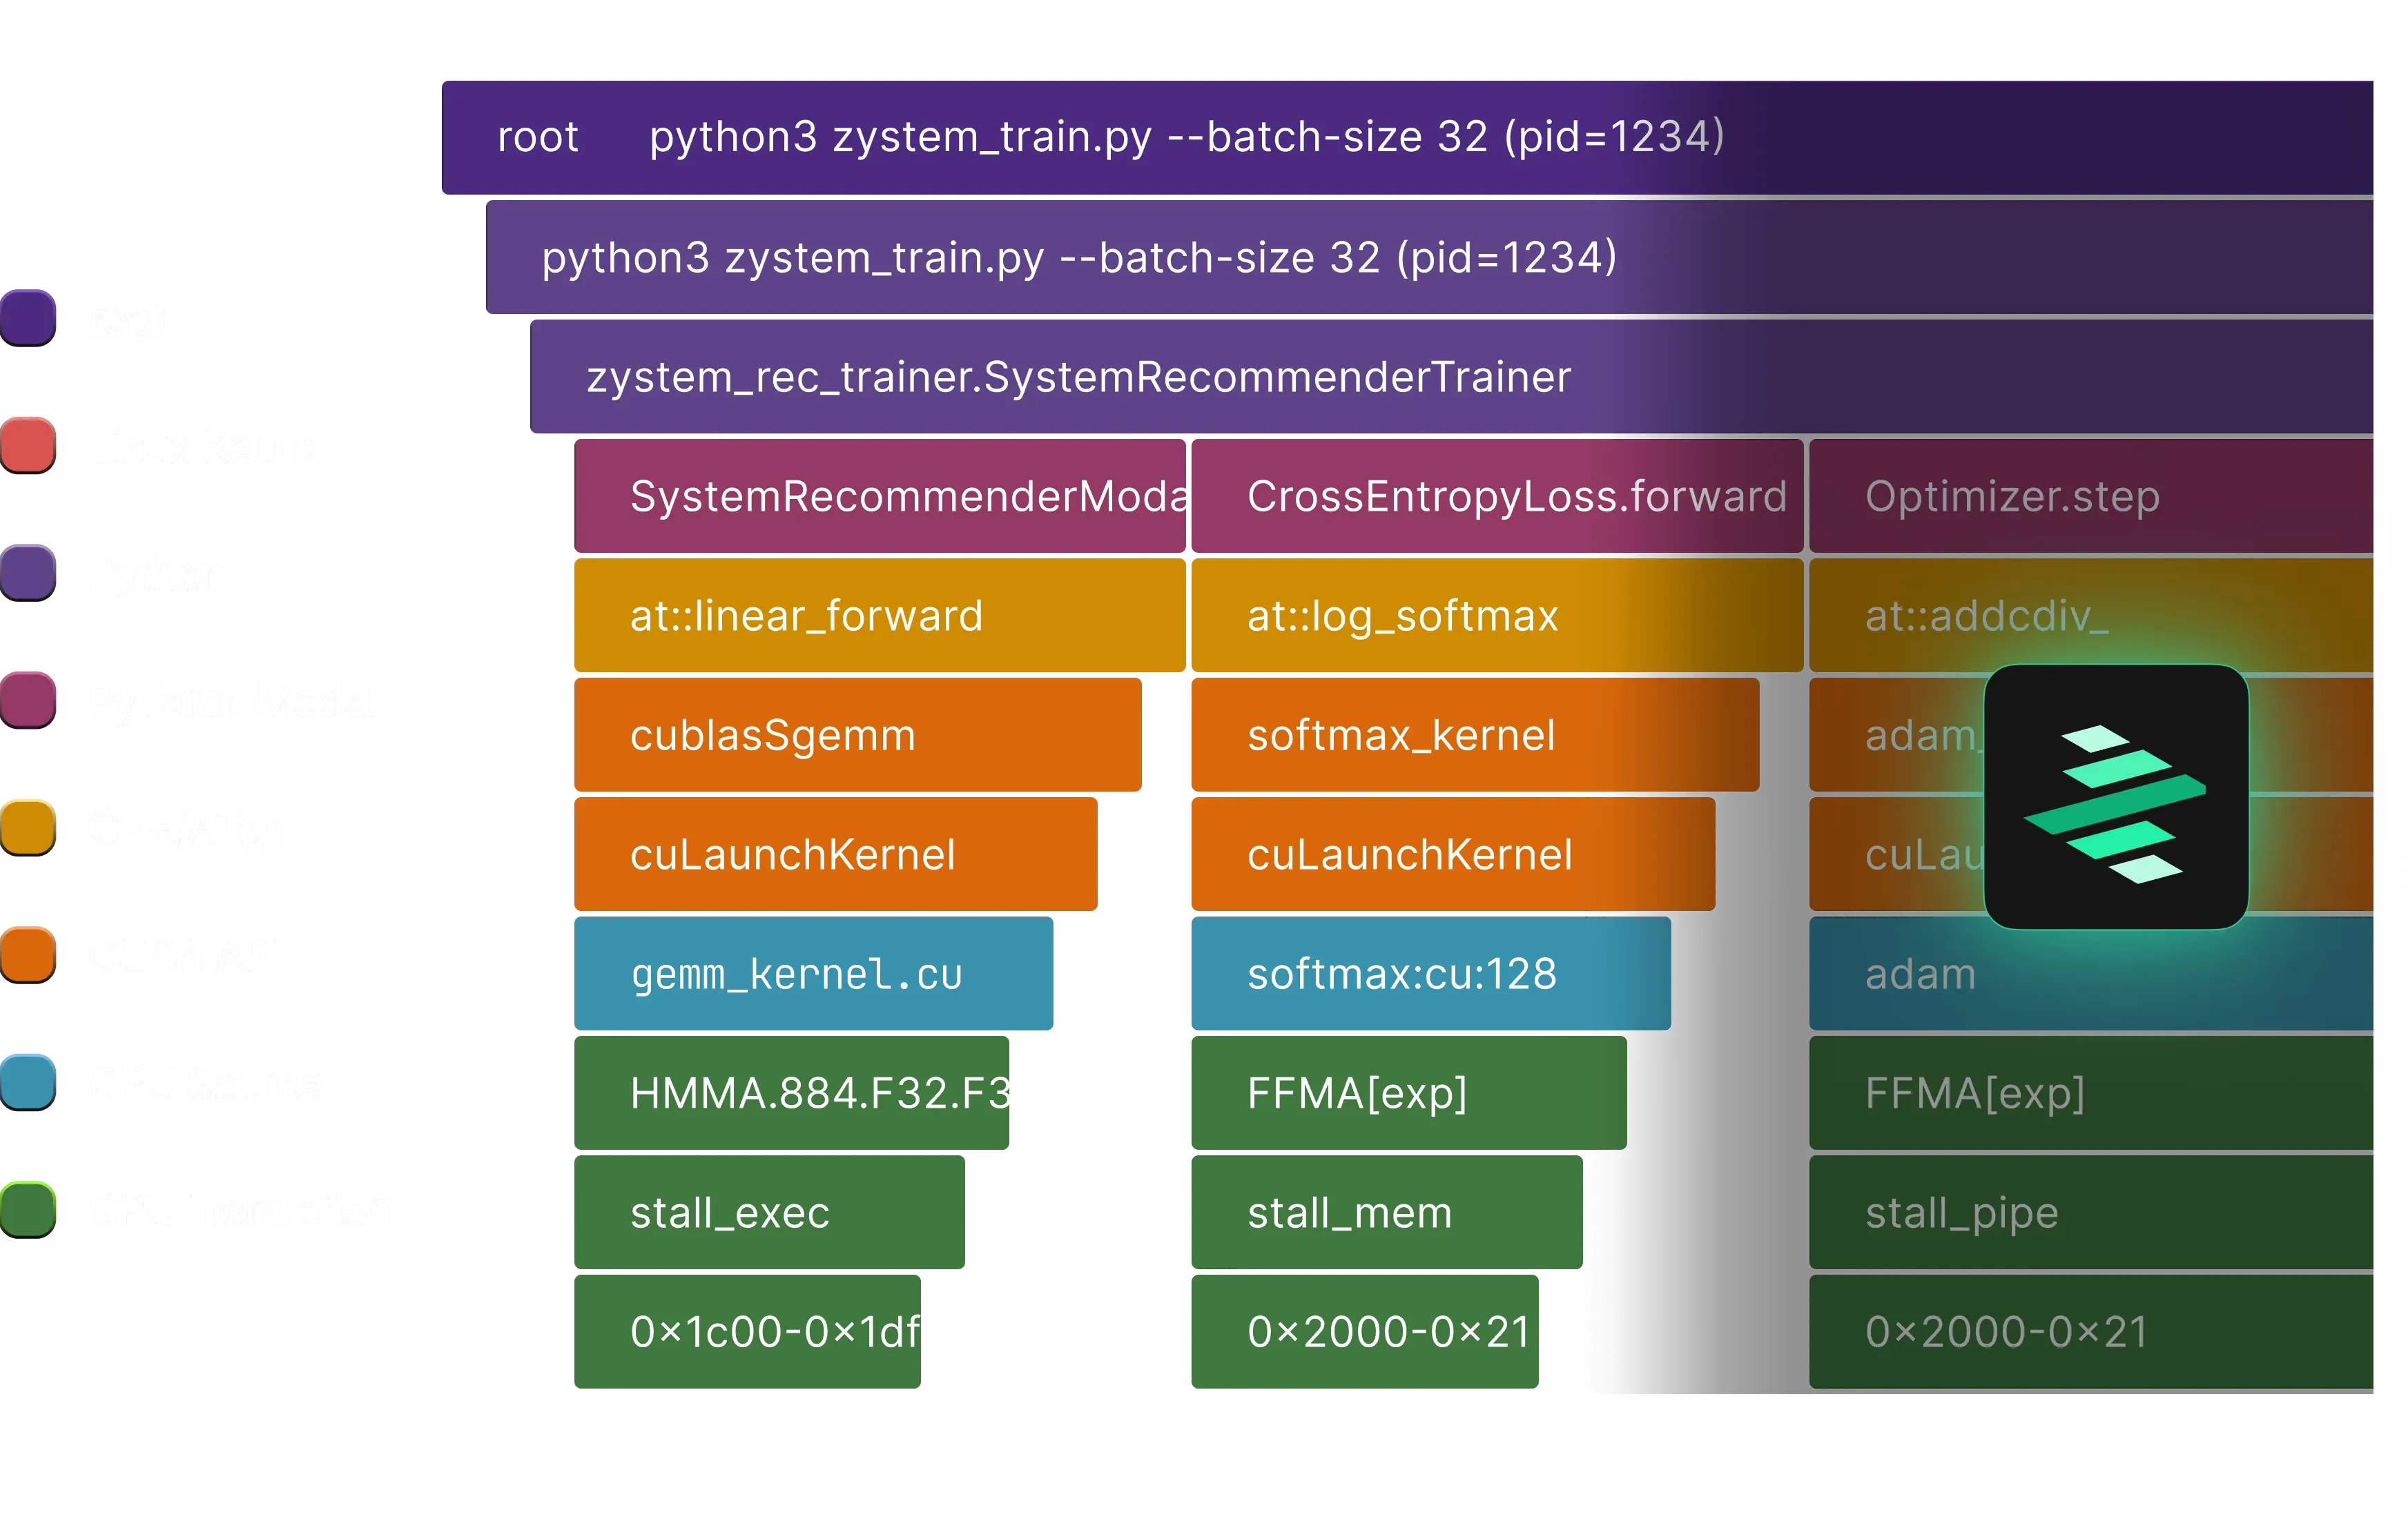
This evolution demands a shift in our approach to observability. Metrics, logs, and traces provide valuable insights but are insufficient for identifying critical performance bottlenecks—especially those arising from the complex interactions between hosts and hardware. For example, troubleshooting the performance of a high-level Python application all the way from user-space, CUDA kernels to the Linux kernel requires a level of insight that can only be provided by profiling the system. Uncovering these inefficiencies necessitates whole-system, continuous profiling to expose ‘unknown unknowns’ and detect wasteful computations that would otherwise remain hidden.
However, existing profiling solutions are not built for these new and emerging compute environments.
The Limitations of Existing Profiling Tools
The current continuous profiling tools are ill-equipped for this new heterogeneous computing environment. They fall short in critical ways:
- Narrow focus: Most tools focus solely on traditional, CPU-bound applications, neglecting the critical performance needs of GPU-bound applications and inference.
- Invasive Instrumentation: They often require manual code modifications for each application, adding significant overhead to development cycles and hindering agility.
- Vendor Lock-in: Proprietary GPU profilers tie you to specific hardware vendors, making it impossible to optimize across heterogeneous environments.
- Significant Overhead: Most GPU profiling tools can introduce substantial performance overhead (up to 25x in some cases), rendering them unsuitable for production environments where efficiency is paramount.
- AI/ML Blind Spots: Limited support for frameworks like PyTorch means these tools can’t effectively analyze modern AI workloads
Why zymtrace & why now?
zymtrace was purpose-built to meet these challenges head-on, equipping software and AI/ML engineers with deep system visibility into CPU⇄GPU interactions. But visibility alone isn’t enough—zymtrace delivers actionable recommendations that guide engineers to the optimizations that matter most.
Our mission is simple: to accelerate the world’s transition to cost-efficient and sustainable computing. In today’s AI-driven landscape, organizations shouldn’t have to choose between performance and efficiency.
With zymtrace, you can do more with fewer GPUs and lower your COGS (Cost of Goods Sold).
Most profilers throw flamegraphs at you and expect you to decode them. zymtrace tells you exactly what’s happening and shows you precisely what to do about it.
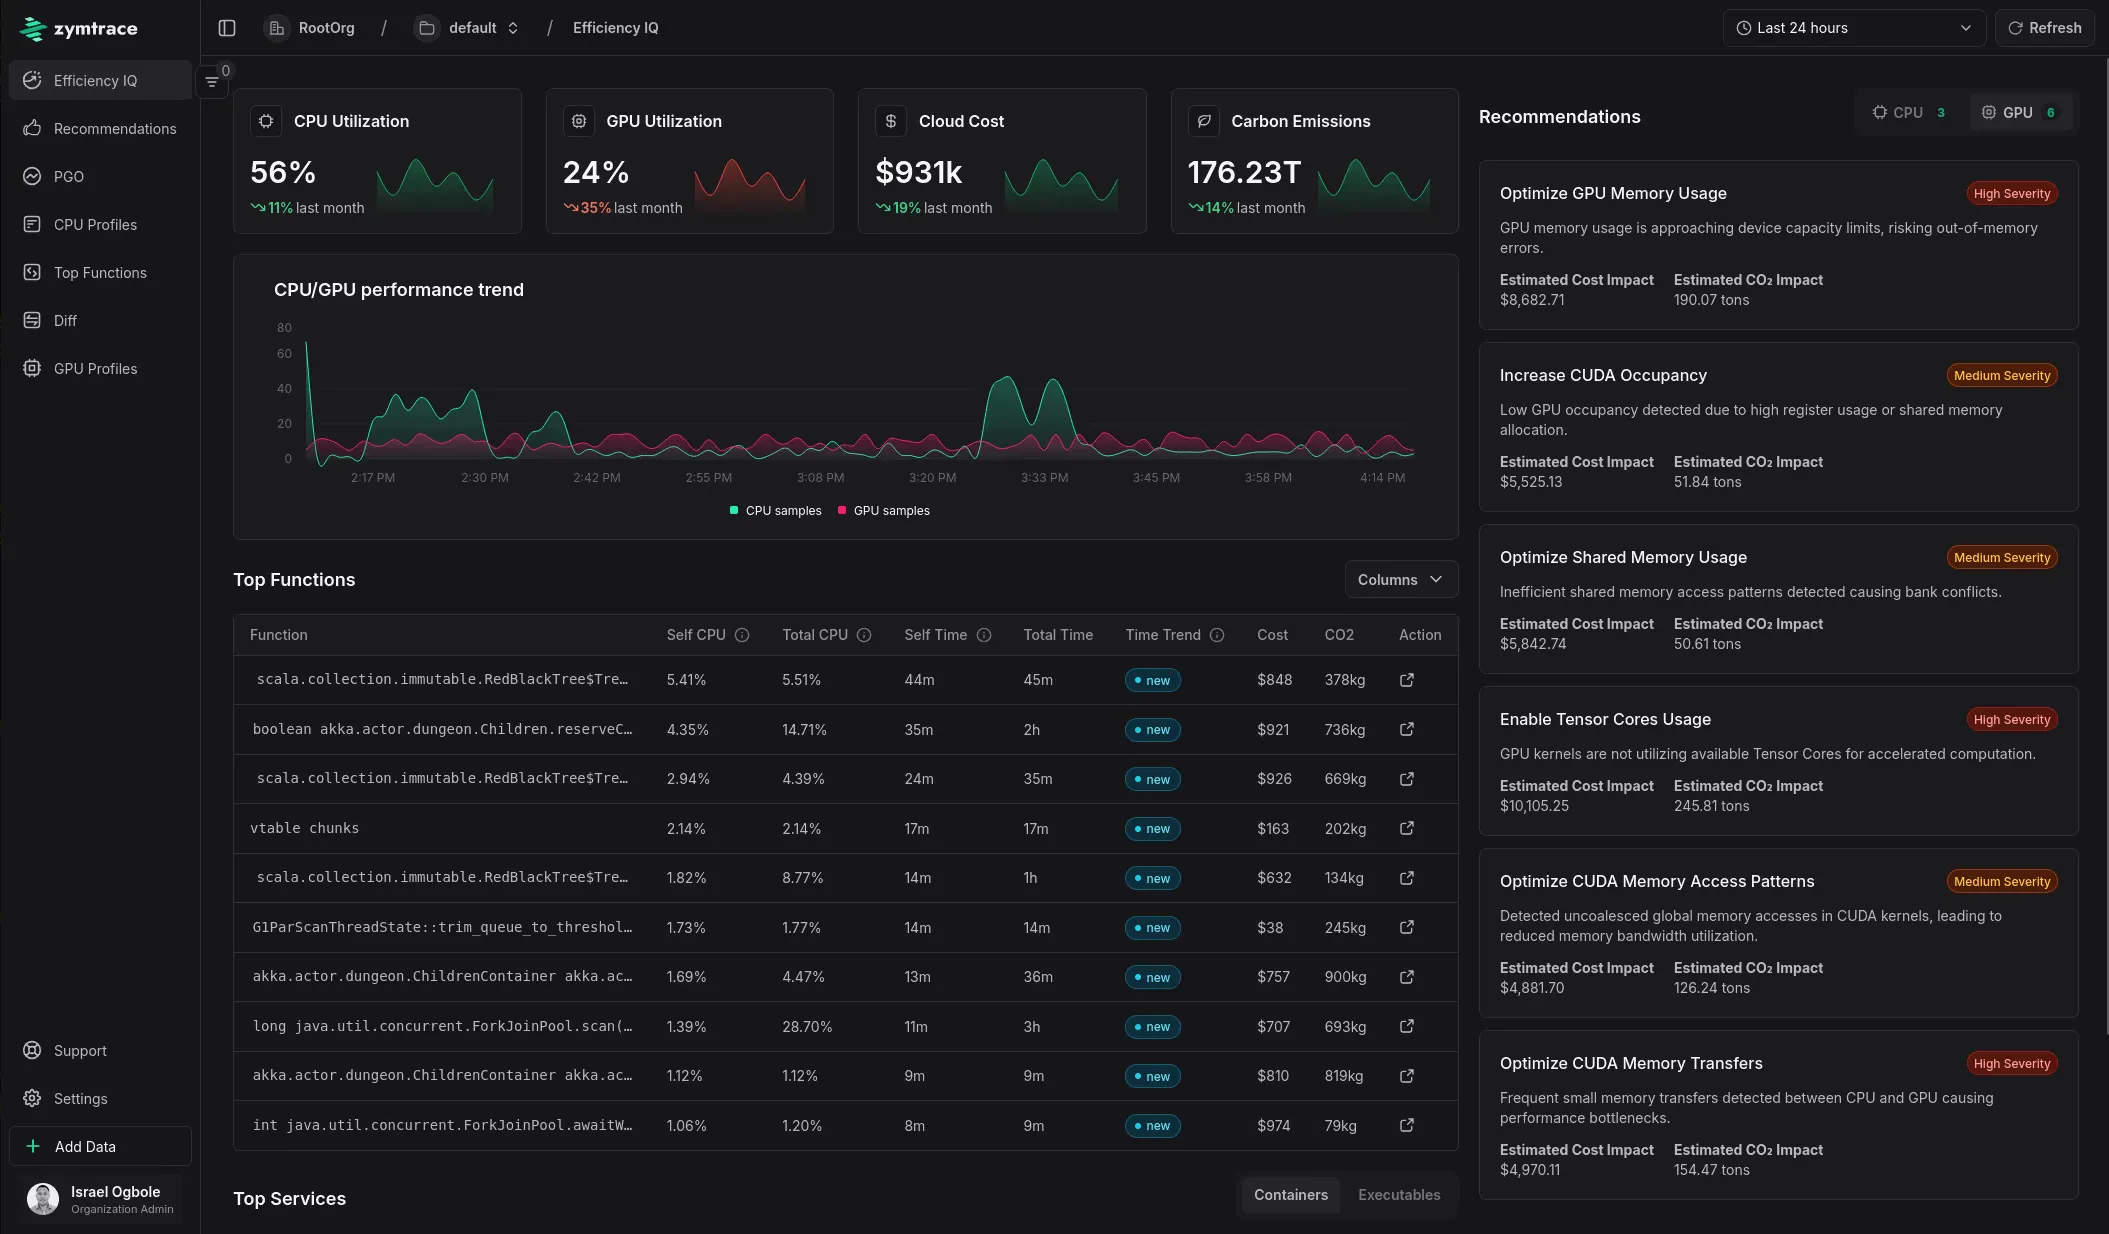
zymtrace's Efficiency IQ dashboard

Today’s Launch
We’re building zymtrace with a clear vision: software that runs faster, costs less, and is greener. Our journey is defined by three key objectives:
- Frictionless CPU-bound visibility: Drop-in optimization for general-purpose compute workloads
- GPU Profiling: Profile GPUs and AI accelerators, starting with NVIDIA CUDA, correlated with CPU call-stacks to expose bottlenecks across the stack
- Business Insight: Correlate performance data, cost, and carbon emissions to drive business and engineering prioritization decisions.
Today, we’re proud to deliver on our first objective: Whole-system CPU-bound workload optimization. Our eBPF-powered solution provides unmatched visibility from kernel to high-level applications, empowering you to:
- Profile production workloads with minimal overhead
- Identify performance bottlenecks at every layer of the stack
This launch marks the beginning of our mission to transform computing infrastructure.
We will be releasing the GPU Profiling component in the new year. We cannot wait to finish fine-tuning it with our design partners and bring it to market.
Get Started Today
Request access here, and let us know if you require support for TensorFlow, PyTorch, and/or CUDA in future releases. We optimize, you save!
The release is fully self-hosted and on-premises, ensuring that all data remains securely within your clusters and data centers.