Zymtrace vs Other Profilers
See how Zymtrace compares to other (eBPF) profiling tools
How Zymtrace compares to other eBPF profiling tools
Overview
Most profilers help you inspect a process. Zymtrace helps you operate production infrastructure efficiently.
It provides continuous, cluster-wide profiling across CPU and GPU workloads, with absolute compute utilization insight that translates directly into performance and cost optimization. Instead of asking “what is slow?”, you can answer “what is this costing me, and how do I fix it?”
Our founding team built the eBPF CPU profiler, open-sourced it and donated it to OpenTelemetry. Today, it is widely used across the ecosystem, including Grafana, Datadog, Cisco, and others.
Several vendors in this category build on that same foundation. Polar Signals’ parca-agent is a thin wrapper around the profiler we built and open-sourced. Coroot took a different approach and built their own independent implementation outside the OpenTelemetry ecosystem.
Zymtrace builds on that original work to solve the next layer of problems: operating large-scale, heterogeneous AI and production infrastructure.
What makes Zymtrace different
Cost-aware profiling
Cloud compute is billed per core-second. Most profilers express CPU usage as relative percentages, which tells you nothing about what you are actually paying. Zymtrace shows both relative and absolute CPU consumption. Instead of “17% of samples”, you see “100 millicores”, a number that maps directly to your cloud bill.
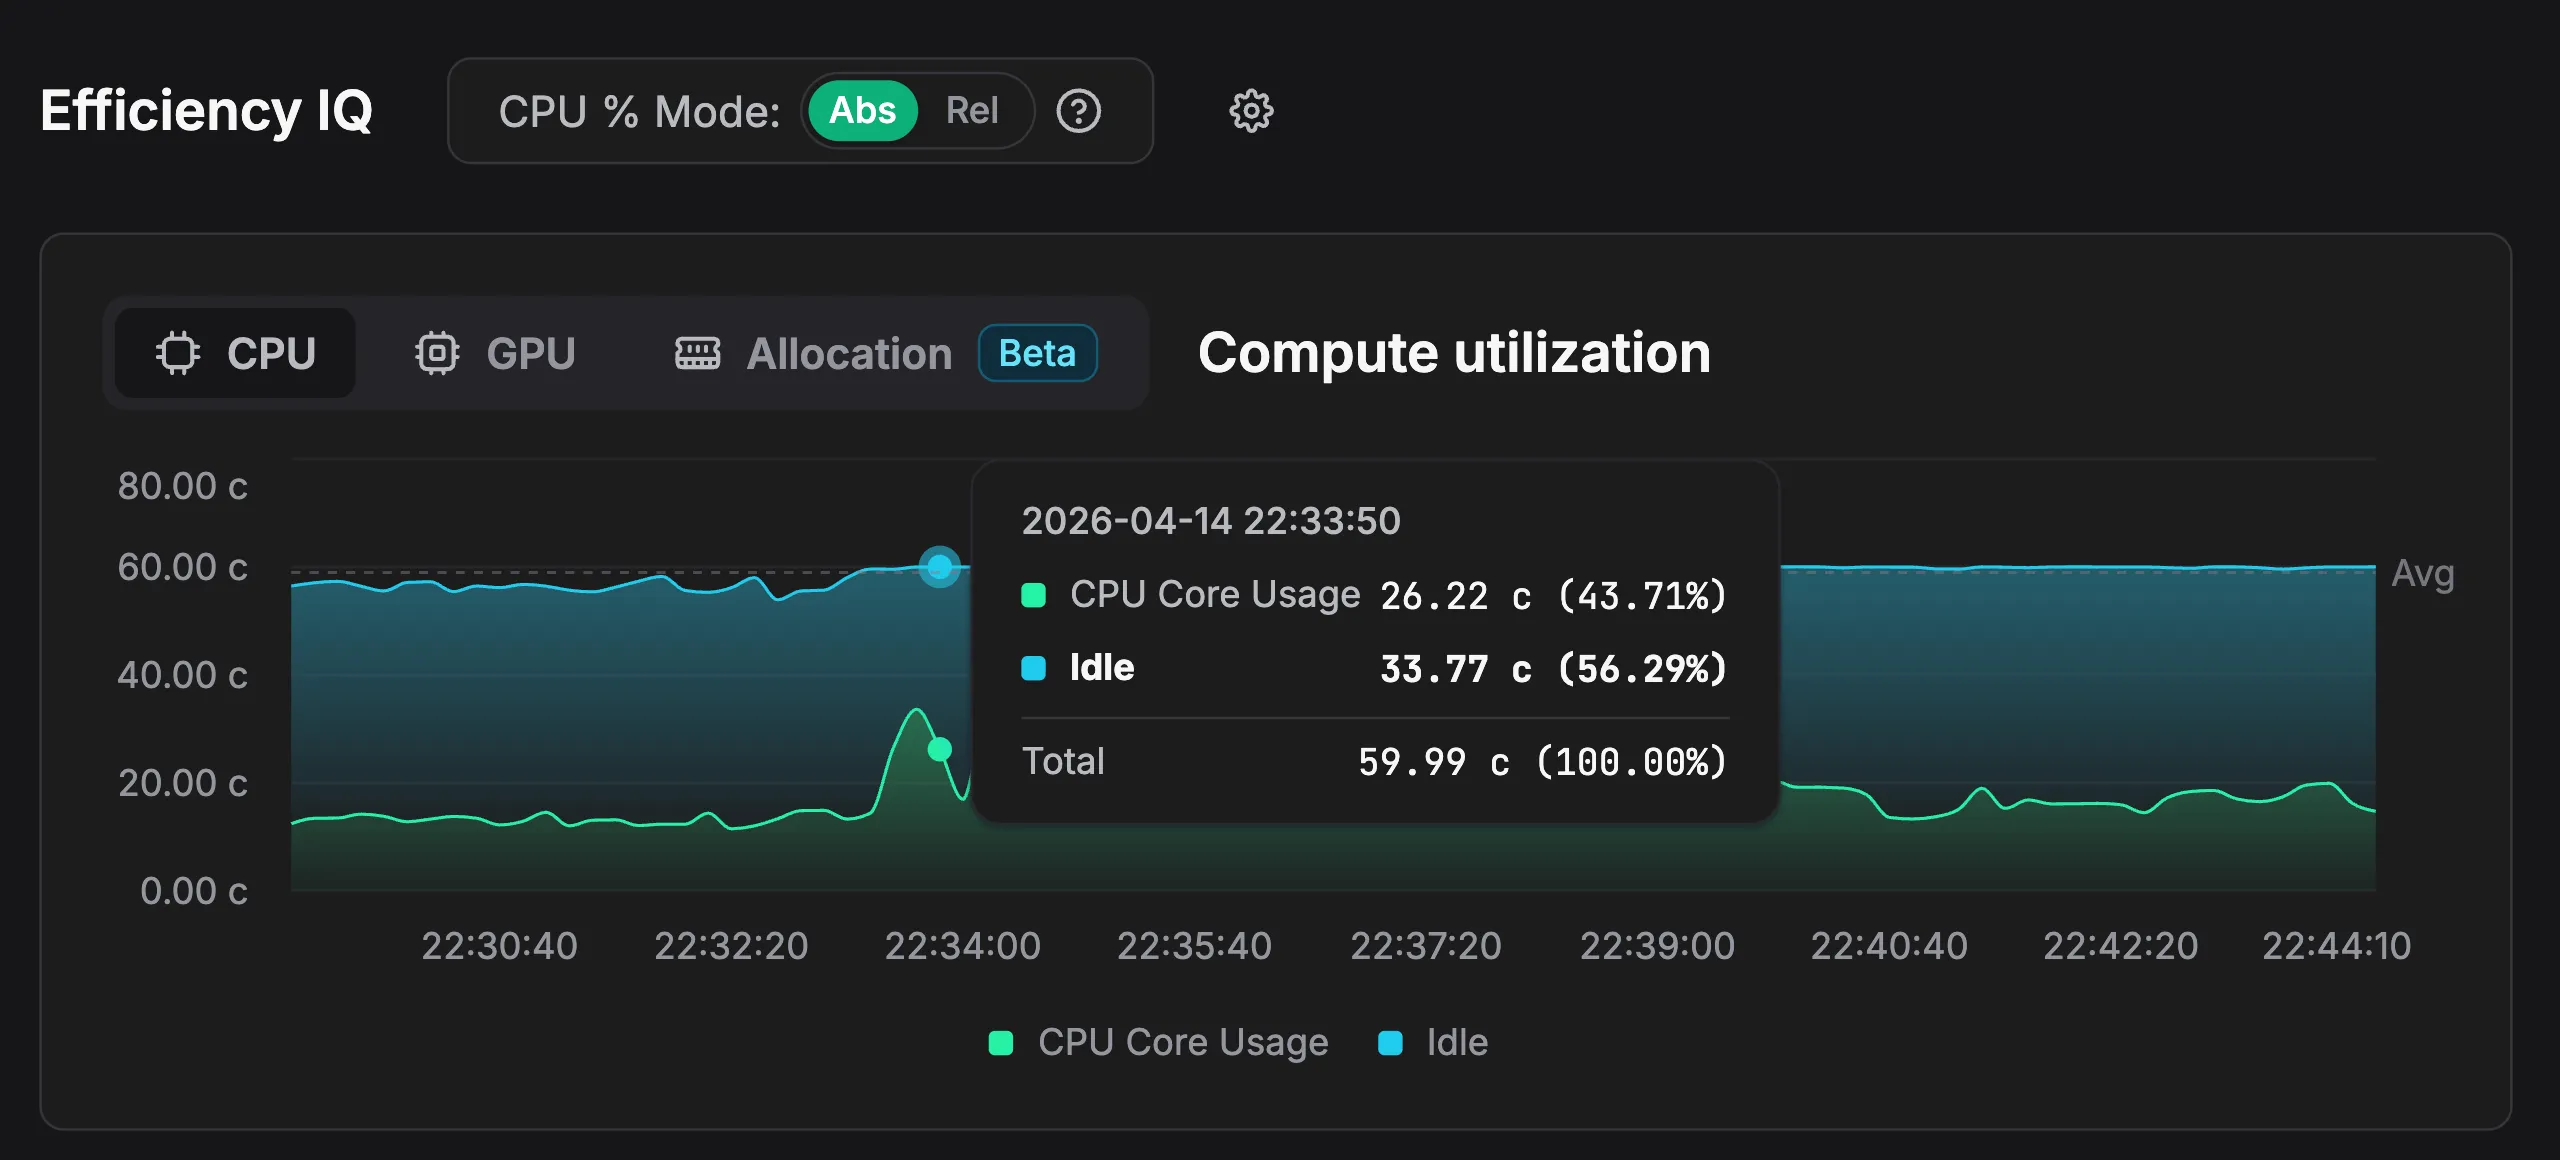
This makes it possible to quantify the cost of a slow function, not just its relative weight in a flamegraph. Teams can prioritize optimizations by dollar impact, not just by sample count.
Global symbolization
eBPF collects raw instruction addresses that must be symbolized to be useful. Zymtrace resolves these automatically through a global symbolization service that continuously indexes common Linux distributions and container images, with support for on-prem mirroring.
Other tools typically require debug symbols to be installed on each host or manually uploaded. In practice, this leads to incomplete or inconsistent symbolization.
Zymtrace delivers fully symbolized, production-ready profiles out of the box without additional operational overhead.
Distributed GPU profiling
Zymtrace pioneered distributed, cluster-wide GPU profiling for heterogeneous workloads. Using eBPF to trace user-space activity and correlate it to CUDA kernel execution, Zymtrace goes deeper inside the GPU than any other profiler: disassembling SASS instructions, surfacing stall reasons, memory access patterns, and offsets, all correlated back to the CPU stack trace that launched the CUDA kernel. Grafana Pyroscope and Coroot have no GPU support at all. Polar Signals later added GPU profiling, but stops at the kernel launch boundary with no visibility into actual GPU instruction execution, stall reasons, or memory access patterns.
See how Anam used Zymtrace GPU profiling to achieve 2.5x faster inference and 90% throughput improvement.
Infrastructure correlation
Zymtrace is built for infrastructure performance, not just profiling. It combines infrastructure signals and profiling data in a single system, allowing teams to move from symptoms to root cause in one step.
For example, when a CPU spike occurs on a pod, Zymtrace surfaces it and enables users to drill directly into the code running at that exact time. CPU metrics are collected via eBPF, avoiding proc-based scraping and its associated overhead and sampling limitations. Similarly, if a vLLM workload shows low token/sec throughput, Zymtrace correlates this with GPU performance metrics and allows users to trace it back to the exact code paths, CUDA kernels, and execution bottlenecks responsible.
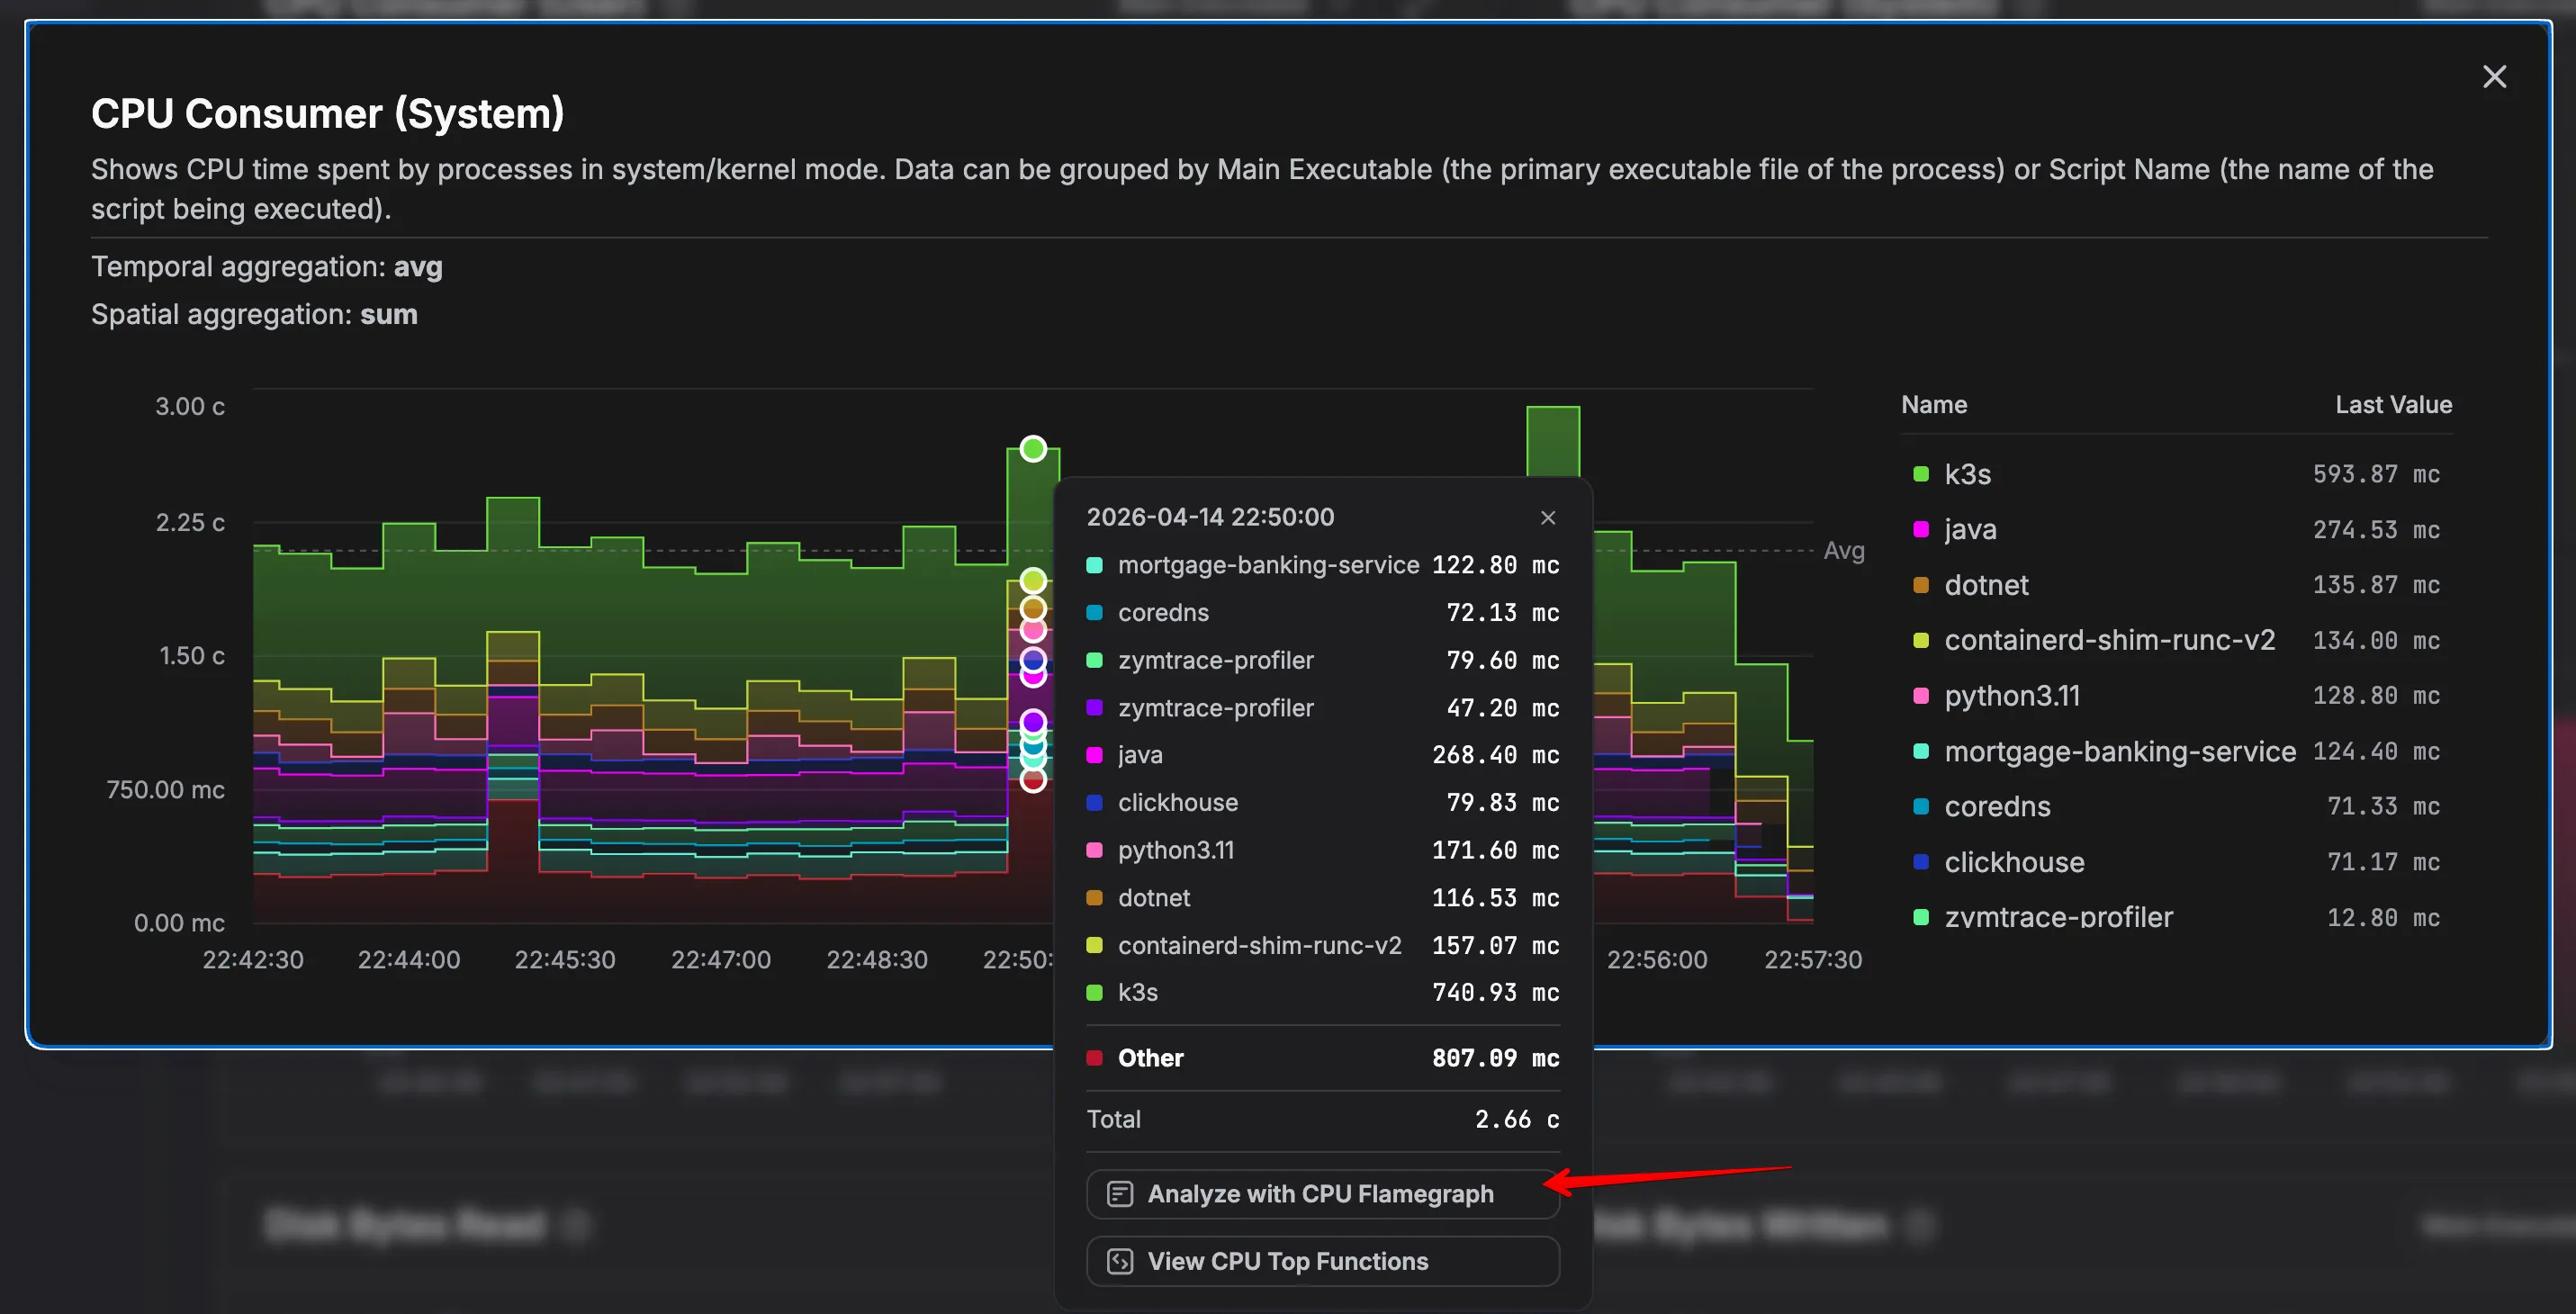
Polar Signals focuses on profiling in isolation and does not provide infrastructure visibility or GPU performance correlation. Other tools typically rely on proc-based collectors or separate metrics pipelines, which introduce additional overhead and require manual correlation across systems.
Zymtrace provides a unified, time-aligned view from infrastructure and GPU performance signals down to the exact code responsible, significantly reducing time to diagnosis.
Operationally efficient storage
Zymtrace stores profiling data in ClickHouse, a database most operations teams already run and understand.
In contrast, tools like Polar Signals (FrostDB) and Grafana Pyroscope (Mimir-based storage) introduce proprietary or less common backends that teams must learn, operate, and maintain.
This becomes a long-term operational burden, particularly in self-hosted deployments where teams are responsible for the entire data pipeline.
Zymtrace fits into existing infrastructure, eliminating the need to take on and support additional storage systems. See the Zymtrace architecture for a full breakdown.
JVM and memory profiling without code changes
Zymtrace profiles Zing, Zulu, and other JVM variants using eBPF, with no code changes or restarts required. It also supports always-on memory allocation profiling.
Other tools are typically limited to HotSpot or require SDKs, instrumentation, or restarts to capture allocation data.
Zymtrace allows continuous, production-safe profiling across JVM variants without disrupting workloads. Read more about Java allocation profiling in production.
Scalable WASM-powered flamegraph rendering
Zymtrace is designed for production-scale profiles. Its flamegraph renderer is written in Rust, compiled to WebAssembly, and rendered via WebGL/GPU, ensuring smooth interaction even with high-cardinality datasets.
In contrast, most profilers rely on SVG or canvas-based rendering (including async-profiler), which becomes slow or breaks down as profile size increases.
Zymtrace keeps the UI responsive at scales where traditional approaches struggle. Read more about why we ditched TypeScript for Rust and WebAssembly.
Profile-guided AI optimization
Zymtrace exposes CPU, GPU, and Java allocation profiles via MCP to AI coding agents like Cursor and Claude Code. This gives AI agents actual execution data, not guesses, enabling autonomous, production-grounded optimization.
Most vendors expose raw API exports that exhaust LLM context windows. Zymtrace applies intelligent flamegraph culling, stack collapsing, and CSV formatting to reduce token usage by up to 20x, making AI analysis economically viable at scale.
We are rapidly expanding the full agentic workflow.
The table below summarizes the key differences. A detailed breakdown follows for those who want to go deeper.
At a glance
| Zymtrace | Polar Signals | Coroot | Grafana Pyroscope | |
|---|---|---|---|---|
| eBPF profiler lineage | Original creators | Downstream fork | Independent | Downstream fork |
| Global symbolization | ✅ Automated + global service + on-prem support | ⚠️ Cloud-centric; manual for self-hosted | ⚠️ Per-node only | ⚠️ Limited |
| GPU profiling | ✅ Instruction-level with CPU correlation | ⚠️ Kernel launch only | ❌ | ❌ |
| Cost-aware profiling | ✅ Absolute + relative compute utilization | ❌ | ❌ | ❌ |
| Java: Zing / Zulu | ✅ Supported | ❌ | ❌ | ❌ |
| Java allocation profiling | ✅ Always-on, no instrumentation | ❌ | ❌ | ⚠️ Requires SDK |
| JIT / deoptimization tracking | ✅ Tracks JIT behavior and deoptimization events | ❌ | ❌ | ❌ |
| Always-on overhead | 50-100 mcores | Not reported | Not reported | Variable; mixture of SDK and eBPF |
| Storage backend | ClickHouse | FrostDB (proprietary) | ClickHouse | Mimir-based (proprietary) |
| Flamegraph renderer | WebAssembly + WebGL | Standard | Standard | Standard |
| Host metrics (eBPF) | ✅ Integrated | ❌ | ✅ | ⚠️ Separate pipeline |
| Profile + infra correlation | ✅ Native | ❌ | ✅ | ⚠️ Manual |
| Profile-Guided AI Optimization | ✅ CPU + Kernel + GPU SASS + GPU stall + GPU Memory context | ⚠️ CPU + Kernel only | ⚠️ CPU | ⚠️ CPU |
For additional capabilities not covered in the summary above, see the detail tables below.
Additional detail
OTel Compliance
| Zymtrace | Polar Signals | Coroot | Grafana Pyroscope | |
|---|---|---|---|---|
| OTel profiles compliance | ✅ | ✅ | ❌ Not compliant | ✅ |
GPU profiling
| Zymtrace | Polar Signals | Coroot | Grafana Pyroscope | |
|---|---|---|---|---|
| MIG-aware | ✅ Per-partition profiling on A100/H100; correctly attributes GPU time per slice in shared infrastructure | ❌ | ❌ | ❌ |
| SLURM-aware | ✅ Profiles attributed to jobs, steps, and tasks across HPC and AI training clusters | ❌ | ❌ | ❌ |
| NVTX annotations | ✅ Ingests NVTX ranges from PyTorch training loops; bridges GPU kernel execution with high-level training logic | ❌ | ❌ | ❌ |
✅ Supported ⚠️ Partial / caveats ❌ Not supported