

Zymtrace’s cluster-wide GPU profiler now supports NVTX. When your framework or model emits NVTX annotations, the CUDA kernels they launch show up in our AI flamegraph with the model layer, submodule, input shapes, and execution phase that launched them, turning a hot kernel into an actionable lead. The rest of this post shows what that looks like in a vLLM example, why it matters, and what it costs.
When profiling an AI model on the GPU, identifying an inefficient kernel is only the starting point. A profile may show that a CUDA or Triton kernel is consuming most of the time, but the kernel name and its duratioin alone rarely tell you enough to act on it.
Was it running during prefill or decode? Was it part of attention, MoE routing, expert execution, or logits processing? Which layer launched it? Which input shape triggered it?
That missing model context is what makes GPU optimization difficult.
Those are the questions NVTX (NVIDIA Tools Extension Library) helps answer, and we’re excited to announce that Zymtrace’s GPU profiler now supports it.
When the framework, model, or application emits NVTX annotations, every CUDA kernel in the flamegraph can carry the model layer, submodule, input shapes, and execution phase that launched it. A repeated kernel name becomes a specific application event, such as:
GptOssForCausalLM.model.layers.18.mlp.experts
NVTX is like a receipt for CUDA kernel execution
NVTX lets frameworks and developers annotate code with labels that describe application-level regions: model layers, inference phases, tensor shapes, CUDA streams, and custom operations. Think of those annotations as receipts for code execution on the GPU.
A CUDA profile without application context is a bit like a credit card statement without receipts. You can see that money was spent, when it was spent, and roughly how much was spent. But you do not always know what was bought, who triggered the purchase, or whether the cost was expected.
CUDA kernel executions feel the same way. The profile shows that a kernel consumed time, but it doesn’t tell you which layer launched it, which inference phase it belonged to, or which input shape triggered it. NVTX acts as the receipt: the application attaches labels to the GPU work it causes, and the profile carries that information back.
In code, an NVTX annotation looks like this:
nvtxRangePushA("forward_layer");

// CUDA kernels or CUDA API calls for this operation

nvtxRangePop();
Ranges can nest, which is how a profiler recovers useful hierarchy such as model, layer, submodule, and operation.
Inference engines such as vLLM support layer-wise NVTX tracing through their configuration, which lets profilers recover model layers, execution phases, and input shapes from the GPU work they trigger.
Using NVTX in Zymtrace
Zymtrace is the first profiler to show NVTX annotations directly inside an AI flamegraph.
That means model context is no longer separate from the execution profile. It sits in the same stack as the framework frames, CUDA launches, kernels, SASS instructions, and stall reasons.
Reading top to bottom, a single flamegraph gives you:
- Python and framework frames (model and inference-engine code)
- Native and Triton execution, including JIT and CUDA launch
- NVTX context, naming the model layer and input shapes
- The CUDA kernel itself
- SASS instructions and GPU stall reasons underneath
One click takes you from “this kernel is hot” to “this is the up
projection in MoE layer 18, the matmul_ogs kernel with SwiGLU fused in,
running over a [16, 2880] input during decode.”
Example: gpt-oss-20b on vLLM
To see this in practice, we ran the gpt-oss-20b model on vLLM with NVTX
annotations enabled.
With the annotations in place, the built-in Zymtrace AI assistant analyzed
the flamegraph and produced a concrete performance analysis. Total GPU
time was 27.16s, and most of it lived in the MoE path. Let’s look at
the key performance issues and recommendations Zymtrace surfaced:
Mixture-of-Experts (MoE) execution dominates GPU time.
The mlp.experts scopes account for roughly 77% of GPU time. Inside
that path, three kernels dominate:
| Operation | Time | What it represents |
|---|---|---|
| swiglu-fused up/gate projection | 8.64s | Expands activation width |
| w2 down projection | 5.61s | Projects expert output back down |
| expert-output reduce | 2.07s | Combines expert outputs |
The up/gate kernel pushes roughly twice the output width of the down
projection, 5760 vs 2880, so it taking the top spot is expected.
Per-layer GPU time is uneven
NVTX also makes layer-level GPU time visible.
In this capture, layer 1 takes around 0.47s, while layer 23 takes
around 0.24s. That is roughly a 2x spread across layers, and layers
0 to 9 consistently cost more than layers 17 to 23.
Without NVTX, this would look like the same kernel repeating across the profile. With NVTX, it becomes a concrete lead: check whether expert routing, token distribution, or layer-specific behavior is creating uneven work.
Routing overhead is significant
Routing is not free either, and NVTX is what makes that visible. It
groups the small routing ops under the mlp.experts scope so they add
up to one attributable subsystem cost, instead of looking like a
handful of unrelated PyTorch kernels scattered across the flamegraph.
Under triton_kernel_moe_forward, the make_routing_data step rebuilds
routing metadata every step. Several smaller operations (zeros, where,
swiglu_scalar, _to_copy, and index_fwds) each launch their own CUDA
kernels. Together, this accounts for around 2.3s, or about 8.5% of
GPU time.
There is also a structural issue: 24 layers times 3 expert kernels
means 72 expert-kernel launches for every decode step. And each
launch is inefficient at this batch size — the fused matmul_ogs
GEMM runs a 16×256×128 (M×N×K) tile where M=16 is the entire decode
batch, so with only 16 rows of real work it’s memory-bound on MXFP4
weight dequant rather than compute. A larger decode batch, more tokens
per expert, or a persistent-kernel MoE path could spread that launch
and dequant overhead over more useful work.
Enabling NVTX
Set these environment variables on the container or host running your workload, and Zymtrace hooks into CUDA and NVTX together:
CUDA_INJECTION64_PATH="/opt/zymtrace/profiler/libzymtracecudaprofiler.so"
NVTX_INJECTION64_PATH="/opt/zymtrace/profiler/libzymtracecudaprofiler.so"
For vLLM, enable per-layer NVTX annotations with:
--enable-layerwise-nvtx-tracing
--enforce-eager
Basic vLLM command used in this example
#!/usr/bin/env bash
docker rm -f vllm-gpt-oss 2>/dev/null || true
docker run --gpus "all" --privileged \
    -v ~/.cache/huggingface:/root/.cache/huggingface \
    -v /var/lib/zymtrace/profiler:/opt/zymtrace/profiler:ro \
    --rm -d \
    -e RUST_LOG="zymtracecudaprofiler=info" \
    -e ZYMTRACE_CUDAPROFILER__PRINT_STATS="true" \
    -e ZYMTRACE_CUDAPROFILER__QUIET="false" \
    -e ZYMTRACE_CUDAPROFILER__ENABLE_PC_SAMPLING="true" \
    -e CUDA_INJECTION64_PATH="/opt/zymtrace/profiler/libzymtracecudaprofiler.so" \
    -e NVTX_INJECTION64_PATH="/opt/zymtrace/profiler/libzymtracecudaprofiler.so" \
    -p 8000:8000 \
    --ipc=host \
    --name vllm-gpt-oss \
    vllm/vllm-openai:latest \
    --model openai/gpt-oss-20b \
    --enforce-eager \
    --enable-layerwise-nvtx-tracing
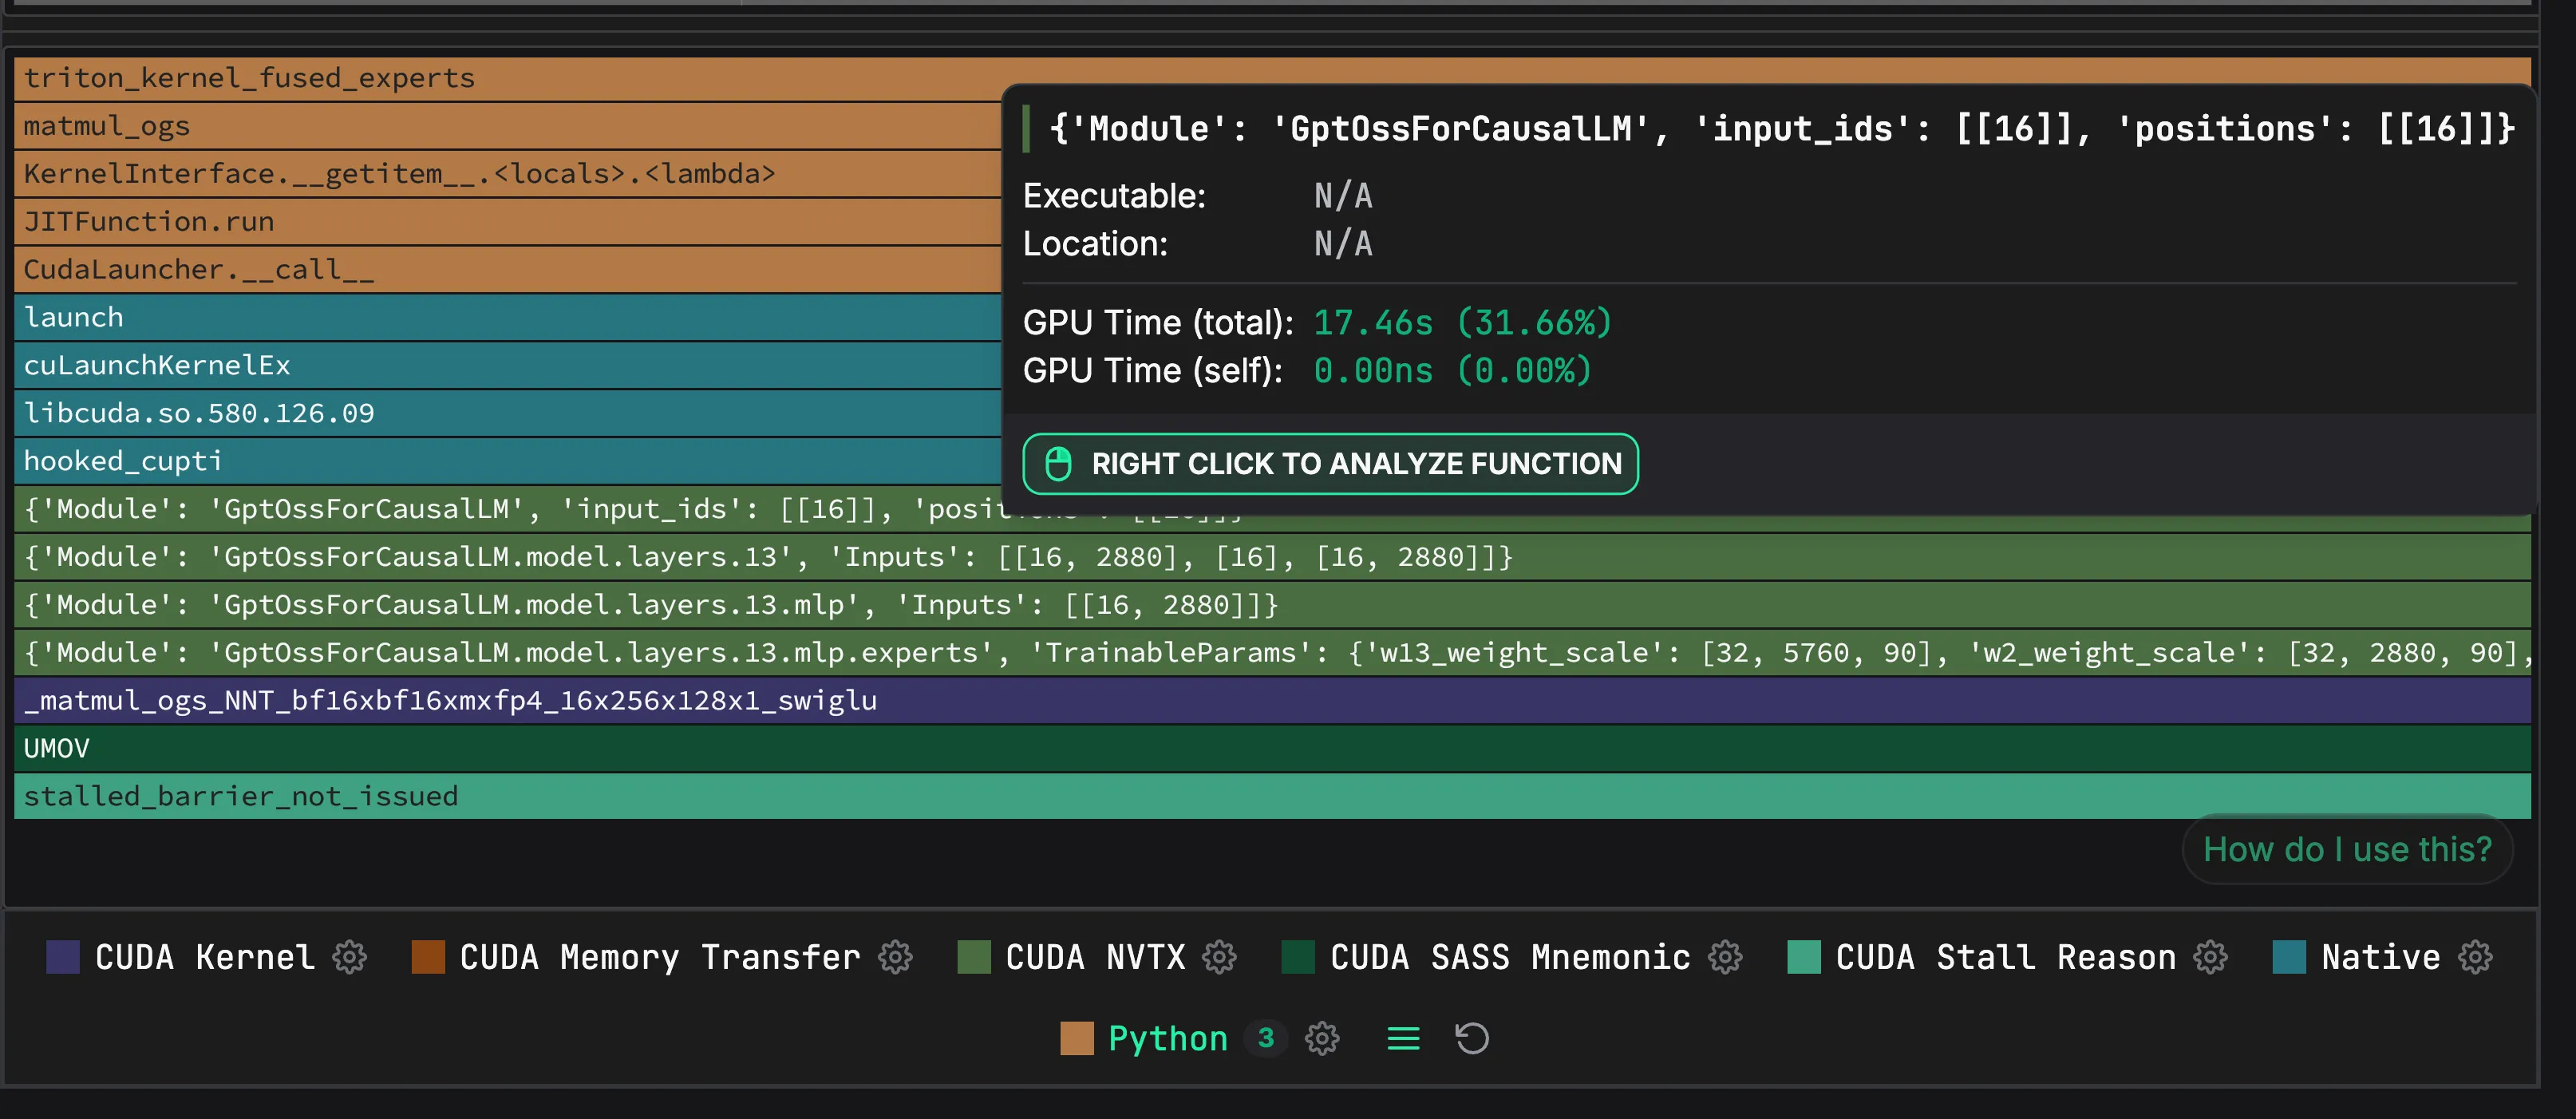
Beyond layer names, Zymtrace surfaces the raw payloads NVTX emits, including input tensor sizes. That makes it easier to spot slowdowns tied to a particular shape:
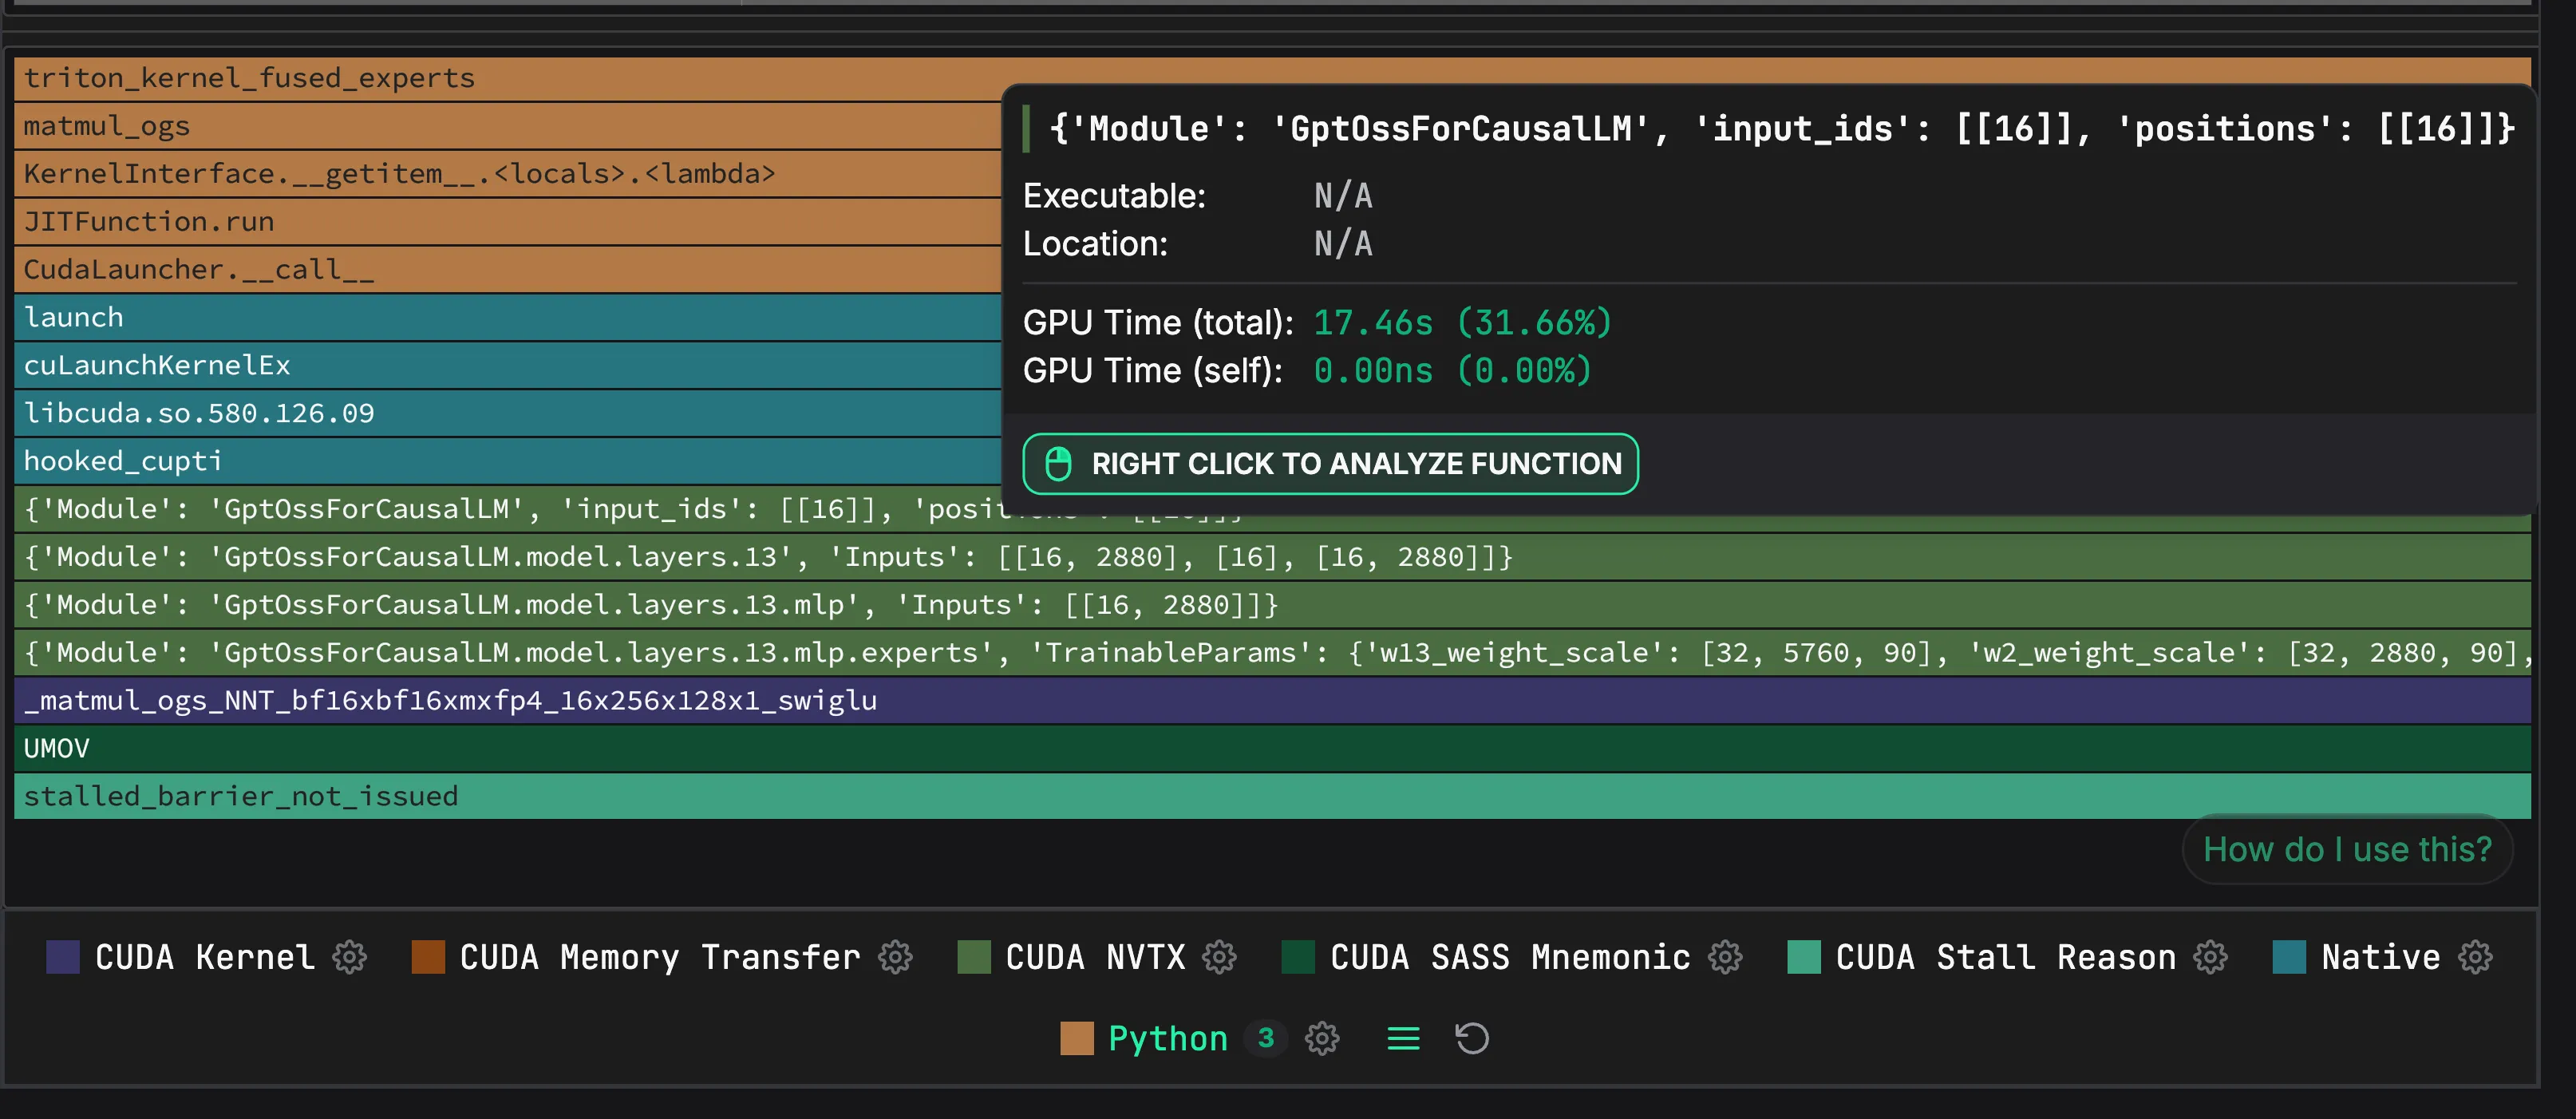
Zoomed-in view: NVTX annotations naming model layers and input tensor sizes inside the flamegraph.
Overhead
We benchmarked the same vLLM workload with Zymtrace running in both configurations: once without NVTX annotations, and once with NVTX annotations enabled.
Measured in output tokens per second, enabling NVTX added less than 0.5% additional overhead.
For model-level debugging on production inference workloads, that is a very acceptable tradeoff.
To wrap up
A hot kernel is only half the story. NVTX helps answer the other half: which layer launched it, which phase it ran in, and which shape triggered it.
Zymtrace stitches that context into one continuous AI flamegraph, from framework code down to CUDA kernels, SASS instructions, and GPU stall reasons.
Sounds interesting?
Get started today at no cost. You can host Zymtrace wherever you want. We provide both Helm charts and Docker Compose configs, so if you are familiar with either, you can have it running in minutes.
Once deployed, the profiling agent continuously profiles running processes on your machines with low overhead. No code changes, no instrumentation required. Profiles for running applications appear automatically in the Zymtrace UI.
For GPU workloads, Zymtrace supports workloads built on CUDA, including frameworks like PyTorch and JAX. For CPU profiling, Zymtrace supports major languages out of the box, including Python, Java, Kotlin, Node.js, PHP, Ruby, .NET, C/C++, Rust, Go, and more.


