Israel Ogbole
Tim Rühsen
10 mins read
•
Profile-Guided AI Optimization
We profiled a thermal diffusion simulation that wasn’t using GPUs efficiently, wasting massive amounts of compute and power on idle cycles. While the bottleneck was clear in the zymtrace GPU flamegraph to an experienced AI/ML engineer, diagnosing and resolving such issues quickly remains a challenge. Deep performance analysis is still a specialized skill, which increases the mean time to resolution for most teams.
To reduce that resolution time and bridge the expertise gap, we connected zymtrace to Claude Code. We asked it to analyze the GPU flamegraph, and Claude Code optimized it within minutes, making it 7.5× faster — without a human touching a single line. The fix relied entirely on the GPU flamegraph and top functions provided by zymtrace.
This approach, which uses profiling data to optimize both general-purpose and AI-accelerated code, is what we call Profile-Guided AI Optimization. It enables AI agents to close the loop from performance measurement to code improvement, cutting mean time to resolution and making expert-level performance tuning accessible to every developer.
Premature optimization is the root of all evil.1
Donald Knuth’s timeless quote feels especially relevant in today’s “vibe coding” era. Optimizing code without data is guesswork. But even with the best intentions, how do you know when optimization is actually needed and, more importantly, where to focus?
Continuous profiling gives you the critical context: it shows where your application spends time, which functions are expensive, which CUDA kernels are inefficient, etc. Yet turning a flamegraph into real performance improvements still requires deep expertise and hours of manual work.
That’s why we’re excited to announce the general availability of zymtrace profile-guided AI optimization. It combines GPU and CPU profiles with AI reasoning to automatically turn performance data into optimized code. The result: engineers ship faster, run leaner, and gain a deeper understanding of performance at scale.
Why Profiles Give AI Superior Context
Metrics, logs, and traces are like checking a patient’s vital signs. They tell you that something is off: a high temperature, a rapid heart rate, or a cold. They provide a general sense of system health and a record of events leading to the symptoms. Profiling, on the other hand, is like taking an X-ray or MRI. It lets you see inside the system, understand how different parts interact, and spot hidden issues that wouldn’t be visible from the surface. With profiling, you can pinpoint the root cause of performance problems rather than just knowing that something is wrong.
For AI, this distinction is critical. Asking an AI agent to optimize your code without profiling data is like giving it a patient chart with only vital signs. You’ll get recommendations based on general heuristics instead of real behavior. With profiling, AI agents can see the inner workings of your application: the obscure function consuming 40% of CPU, a memory allocation pattern slowing everything down, or the CUDA SASS mnemonics (correlated to the CPU stacktrace) invisible to standard monitoring.
This mirrors the evolution of compilers. Traditional compilers rely on heuristics such as rules for dead code elimination, register allocation, and function inlining. These work reasonably well across many programs, but they are one-size-fits-all solutions. A compiler can’t know whether a function call happens once or a million times in your application. Profile-Guided Optimization (PGO) solved this by feeding real execution data back into the compiler, allowing optimizations based on actual runtime behavior rather than generic assumptions.
AI-powered optimization works the same way. With profiling data, it can pinpoint:
Function X in payment-service.py:142consuming 43% of CPU over the last 24 hours- A CUDA kernel with non-coalesced memory access causing a 3x slowdown
- A container wasting cycles on inefficient JSON parsing
AI isn’t guessing anymore—it’s acting on your actual system profile. That’s why profile-guided AI optimization delivers dramatic improvements, far beyond what heuristic-based approaches can achieve.
Real-World Example: Thermal Diffusion Simulation
Building on the Pytorch thermal diffusion use case above, we took a closer look at how zymtrace and Claude Code work together in practice.
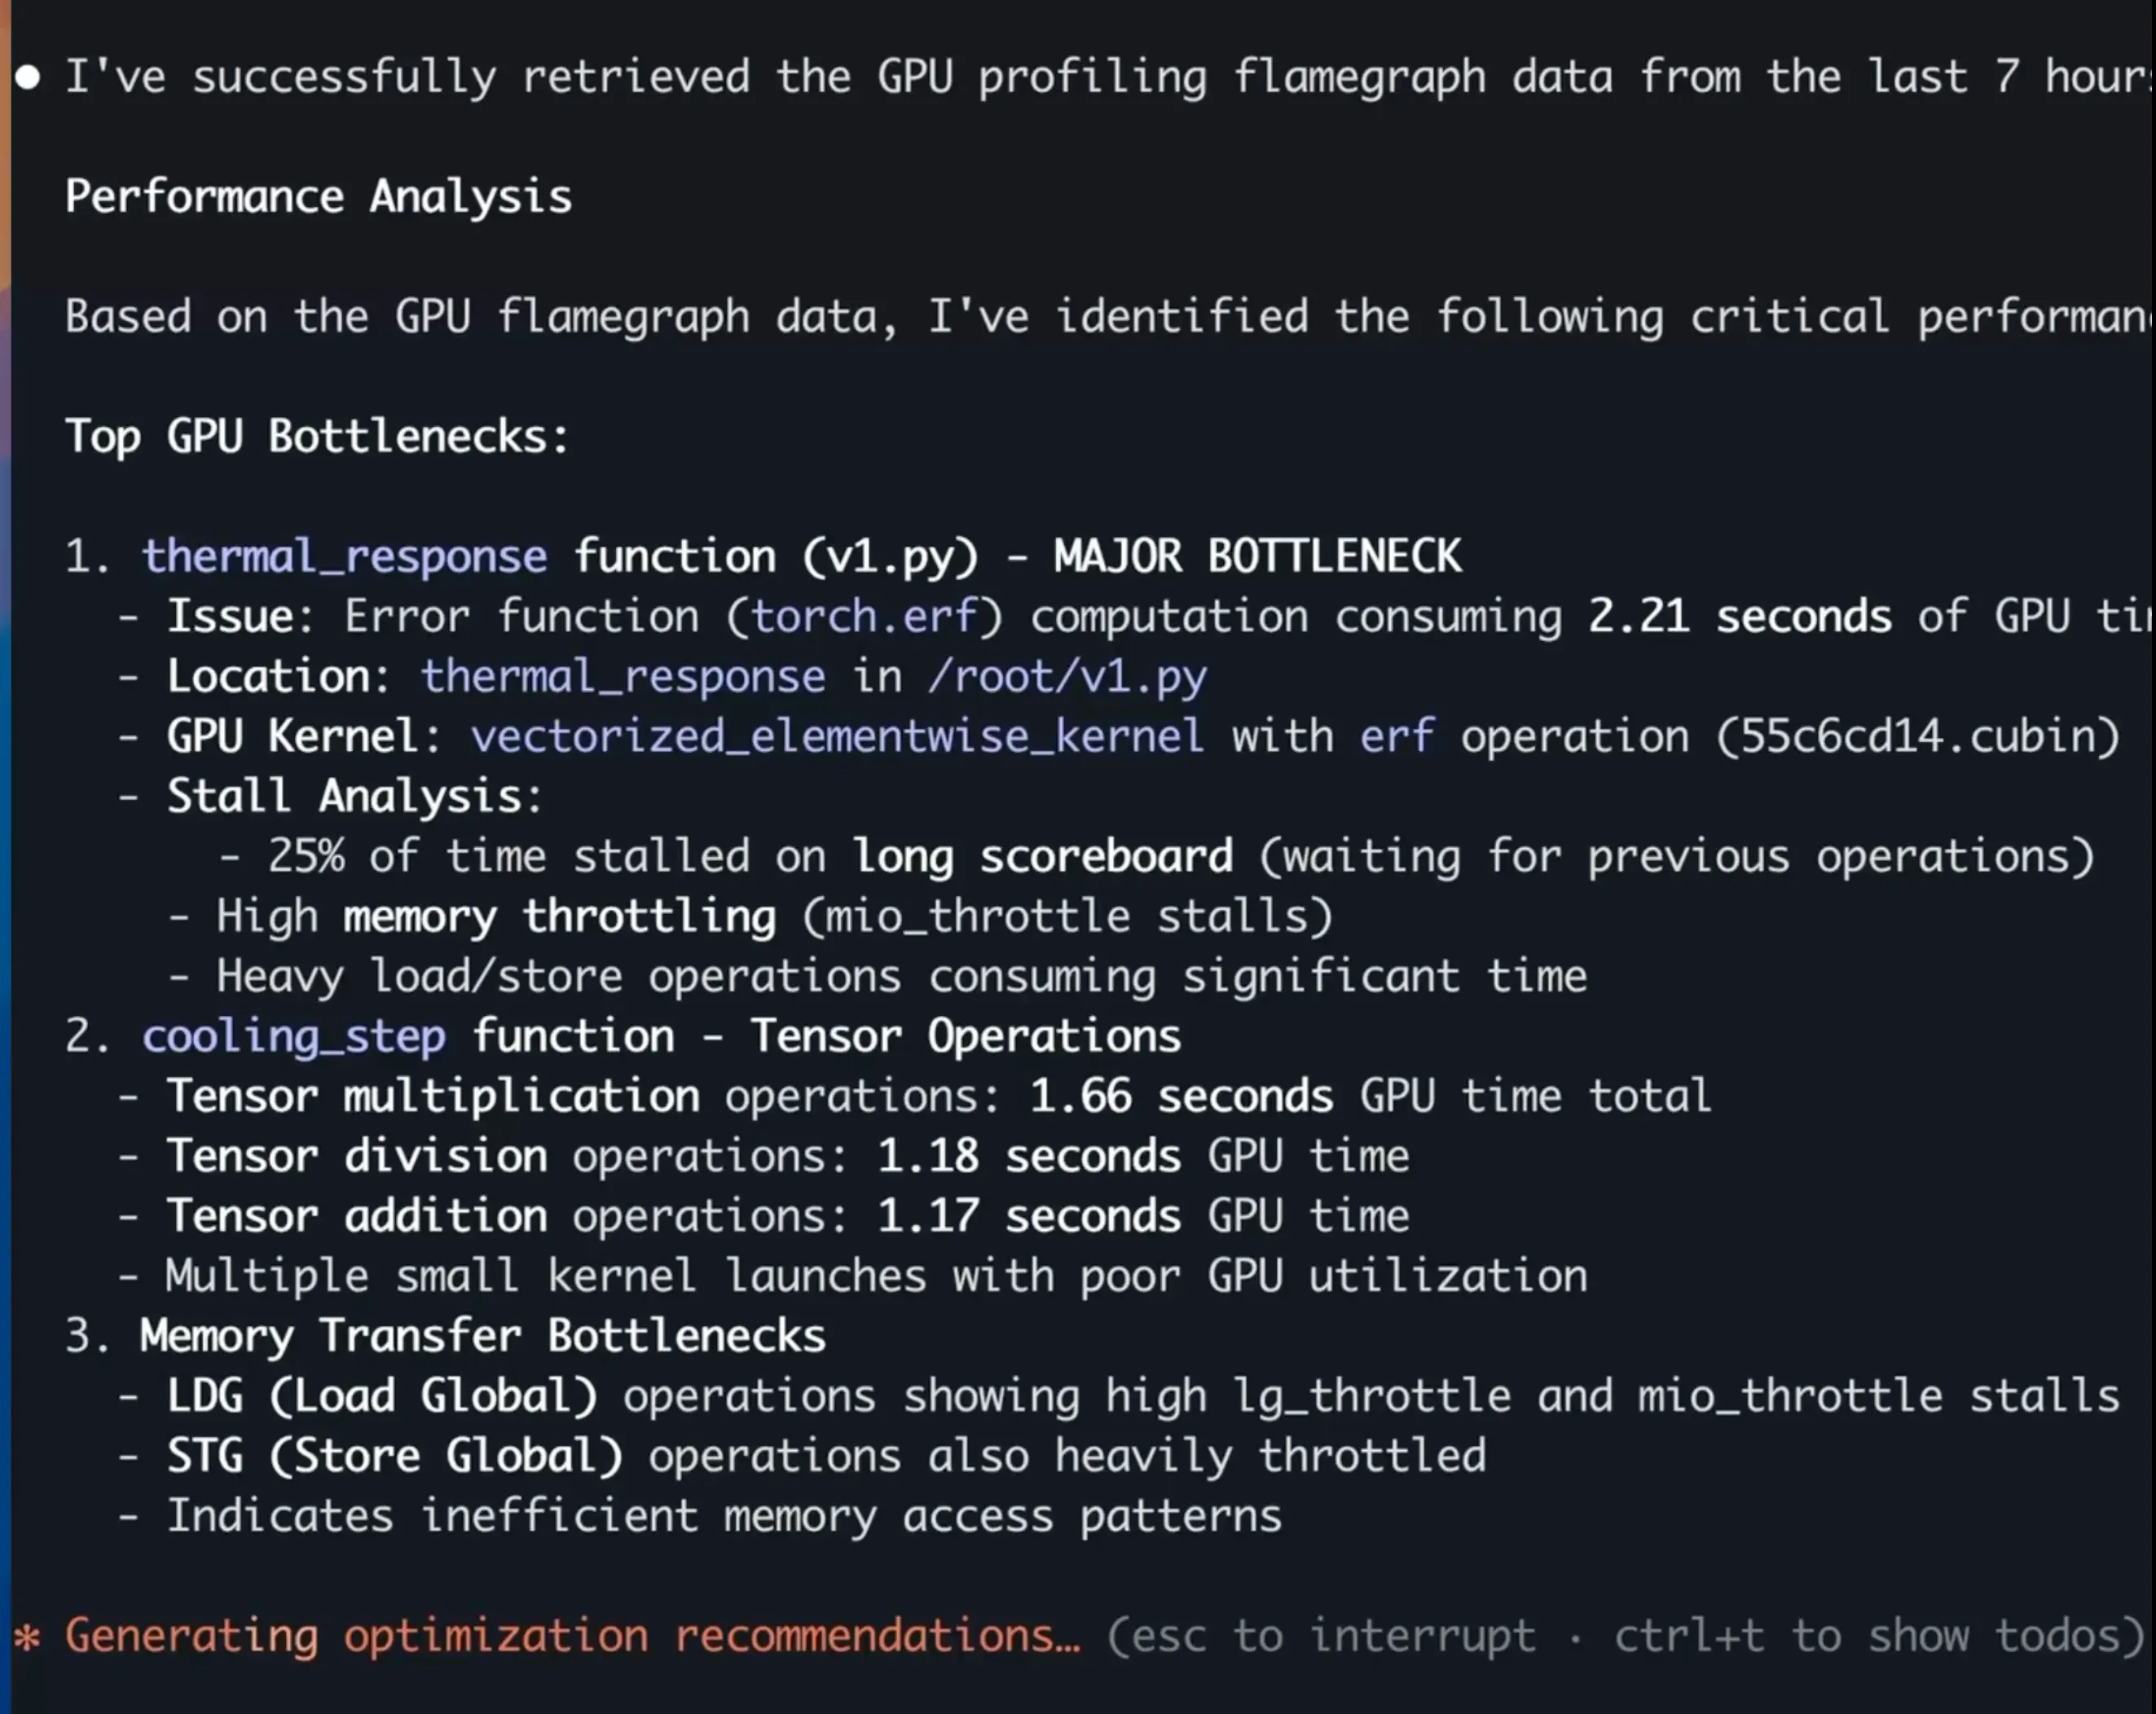
In this case, the zymtrace GPU flamegraph revealed clear inefficiencies: suboptimal CUDA kernel launches and unnecessary host-device data transfers. To investigate further, we asked Claude Code:
My thermal diffusion app is slow. Use zymtrace GPU profiling flamegraph data since 7 hours ago to identify the issues and suggest recommendations.
Claude identified three critical issues, shown in the screenshot below:
It then generated optimized version that improved GPU utilization by7.5x, using only the profiling data as input.
Multiply that efficiency gain across GPU clusters and you’re talking millions of dollars saved and tons of CO₂ avoided.
Here’s the full demo.
Making It Economically Viable
Starting with version 25.11.0, zymtrace includes a local Model Context Protocol (MCP) server that exposes your profiling data to AI assistants:
- GPU and CPU flamegraphs
- Top functions performance metrics
- Hosts, namespace, deployment, pods, container resource utilization
But simply building an MCP server wasn’t enough, we also had to address token economics. Raw flamegraphs can easily exceed token limits and drive up costs. We implemented three key optimizations:
1. Streamline Flamegraph data
We removed noise from flamegraphs before sending them to AI models. We applied the following optimizations.
- Vertical collapsing: Merge consecutive frames with identical kind, function, file, and executable
- Horizontal collapsing: Combine adjacent frames with the same attributes
- libc frame removal: Strip standard library frames before application code
- Kernel frame merging: Consolidate kernel frames into single representative frames (e.g.,
futex,pread64) - Middle-stack libc merging: Combine libc frames within the stack to the actual called function
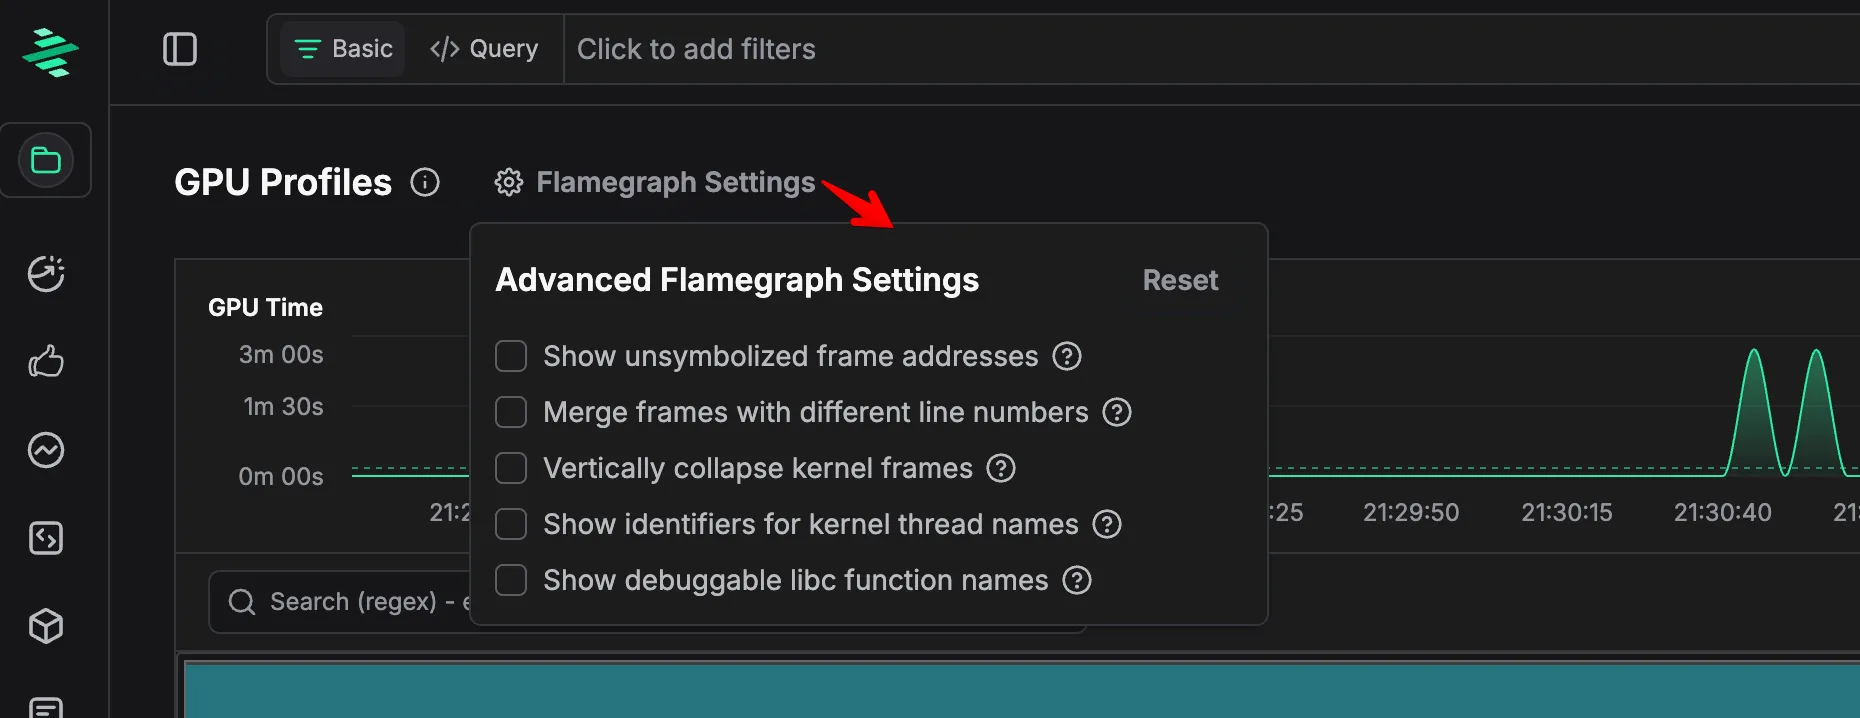
These refinements reduce token usage by up to 20x. We liked these optimizations so much that we made them the default behavior in zymtrace. Users can toggle this in Flamegraph Settings.
2. Flamegraph Culling
We apply a culling threshold to remove minor nodes from the flamegraph. Any node with a share (num_samples / parent_samples) below 0.05 is filtered out, focusing AI analysis on significant performance patterns. This reduces tokens in our test data by 14x on average.
3. CSV Format
We send flamegraph data as CSV rather than JSON or SVG. SVGs hide frame data in rendering. JSON is unnecessarily verbose. CSV provides only the essential data in the most compact token format.
Combined, these optimizations make continuous AI-powered performance analysis practical and affordable at scale.
Getting Started
Connect your coding assistant to zymtrace’s MCP server:
claude mcp add zymtrace \
  --transport http \
  https://your-zymtrace-instance.com/mcp \
  --header "Authorization: Bearer YOUR_TOKEN_HERE"
Alternatively, for Cursor (mcp.json) and Claude Code (~/.claude.json), add:
"mcpServers": {
  "zymtrace": {
    "type": "http",
    "url": "https://your-zymtrace-instance.com/mcp",
    "headers": {
      "Authorization": "Bearer YOUR_TOKEN_HERE"
    }
  }
}
That’s it. Start querying your profiling data in natural language.
If authentication is not enabled in your deployment, please remove the
header section.
To get the base64 string, run the following in your terminal with your username and password:
echo “username:password” | base64Prompt Structure
Once configured, you can ask questions tailored to your specific use case. Structure your prompts with these key components for best results:
| Component | Description | Examples |
|---|---|---|
| zymtrace | Always mention zymtrace | ”in zymtrace”, “using zymtrace” |
| Profile type | Specify CPU or GPU | ”CPU flamegraphs”, “GPU metrics” |
| Analysis type | What you want to see | flamegraphs, top functions, top entities |
| Entity scope | Where to look | container, namespace, pod, script name |
| Time range | When to analyze | last hour, 24 hours, since yesterday |
Template:
"Analyze [PROFILE_TYPE] [ANALYSIS_TYPE] for [ENTITY] in zymtrace over [TIME_RANGE]"For example:
GPU Workload Optimization:
Using zymtrace GPU flamegraph, identify the most inefficient CUDA kernels in our vllm inference pipeline over the last 3 days and suggest improvements
Performance Investigation:
Using zymtrace CPU functions, what are the top 5 CPU-intensive functions in the payment-service container over the last 24 hours?
Cost Optimization:
Find the most expensive functions across our infrastructure and calculate potential savings from optimization, assuming AWS EC2 c5.xlarge instances.
Sounds Interesting?
Get started today at no cost! You can host zymtrace wherever you want. We provide both Helm charts and Docker Compose configs. If you’re familiar with either, you can have it running within 5 minutes.
Once deployed, the profiling agent automatically profiles every process running on your machines with virtually no overhead. No configuration changes, no instrumentation required. Just run it and watch profiles for all running applications appear in our UI!
For CPU profiling, we support all major languages out of the box — both high-level languages that would otherwise require specialized profilers (Python, Java, Kotlin, Node.js, PHP, Ruby, .NET, and more) and native languages like C/C++, Rust, and Go.
For GPU workloads, we support everything that is built on top of CUDA. This also includes frameworks like PyTorch and JAX.
Footnotes
-
Donald Knuth, The Art of Computer Programming: “The real problem is that programmers have spent far too much time worrying about efficiency in the wrong places and at the wrong times; premature optimization is the root of all evil (or at least most of it) in programming.” ↩
