News
New Core Units, Python 3.13+ Support, Zing unwinding, and Major Performance Tweaks

Joel Höner
13 mins read
•
We’ve been heads down shipping new features for a while now, but haven’t shared much along the way. To change that, we’re launching a new blog post series where we want to show interesting updates on the product.
This first article in that series covers major feature releases including CPU & GPU metrics, intuitive core-based units, Python 3.13/3.14 profiling support, Zing unwinding, significant profiler performance optimizations, and backend scaling improvements for large deployments.
Absolute CPU usage
Customers often asked for a way to view CPU usage not just relative to other workloads on the system, but also in terms of the total available compute across their clusters.
For example, imagine a simple setup where your cluster runs only two things: Envoy as a proxy and your service. The total load is the sum of CPU cycles consumed by both: T = E + S = 100%.
Now, if Envoy starts consuming fewer CPU cycles, your service appears to take up a larger part of the total, even though its actual usage hasn’t changed at all. This used to confuse a lot of people.
We’ve now introduced an absolute CPU % mode where usage percentages
directly correspond to what you’d see in tools like btop.
For example: if your cluster has 2 machines with 8 cores each, and your profiled service uses 4 cores on each machine, you’ll correctly see 50% CPU usage assigned to your service.
This approach is much more intuitive, especially in smaller clusters.
To achieve this, we now record both actively used CPU cycles and idle ones. As a bonus, this shows you how many cycles your machines spend idling — a useful indicator that some machines may be underprovisioned (perhaps due to poor K8S node affinity configuration).
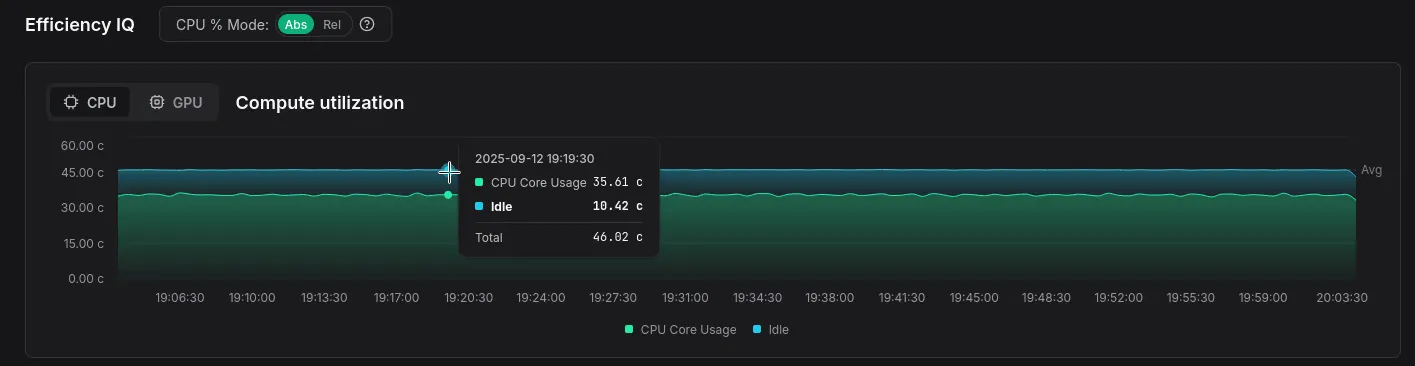
Compute utilization graph now also shows you idle cycles and the total number of cores

Technically, this was much harder to implement than it appears. Both the OTel profiling protocol and our custom protocol were designed to only send stack traces during active work periods. On a completely idle machine, no gRPC requests would be sent at all.
After exploring various approaches, we settled on sending stack traces with idle frames for these inactive periods.
We also rewrote our query-time event sampling approach from scratch to handle
heavy-tailed event count distributions. CPU events usually have the same weight
(1.0), but idle frames are aggregated and often have much higher counts than
normal events.
We’ll save the technical details for another blog post — for now, we’re happy to report that the new approach is both faster and handles these situations well!
Script name attribute
Python and other script language applications share the same main application
name, making them difficult to differentiate and filter. Multiple Python
workloads would all simply show up as python.
We explored several options to improve that and eventually settled on writing language-specific logic to determine the actual main script running in each interpreter instance. Since we’re already peeking into interpreter internals for profiling, we figured we might as well read the correct entry point script from interpreter memory!
This first version is limited to Python, but we plan to extend support to Java and other high-level languages.
Details: why not just use the application’s command line? (click to expand)
Sending the processes command-line (/proc/$PID/cmdline) would probably have
been the obvious choice. We’ve experimented with that, but didn’t like it for
multiple reasons:
- It also contains all other arguments that were passed to the process. This can include password and secrets. It also means that there’s generally a lot of noise in it.
- Depending on the application, it can be very, very high cardinality, making it expensive to aggregate over.
- Paths in the command line are often relative to the application’s working directory. However, by the time that we see the process in the profiler it may have already changed its working directory, making it impossible to construct an absolute path for the script or module being launched.
- Applications using the
python -m some_modulesyntax are particularly ambiguous.
Simply applying a regular expression to the command line is also not super reliable, because Python scripts are also frequently directly invoked via Shebang. Symbolic links add another level of complexity.

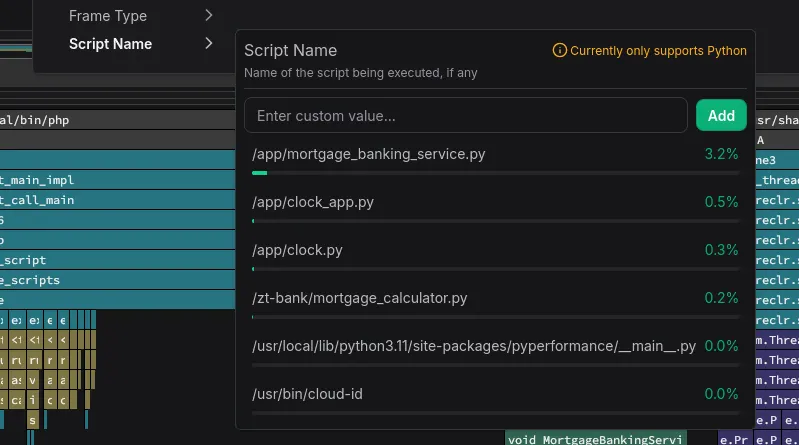
Filter by script name in the UI
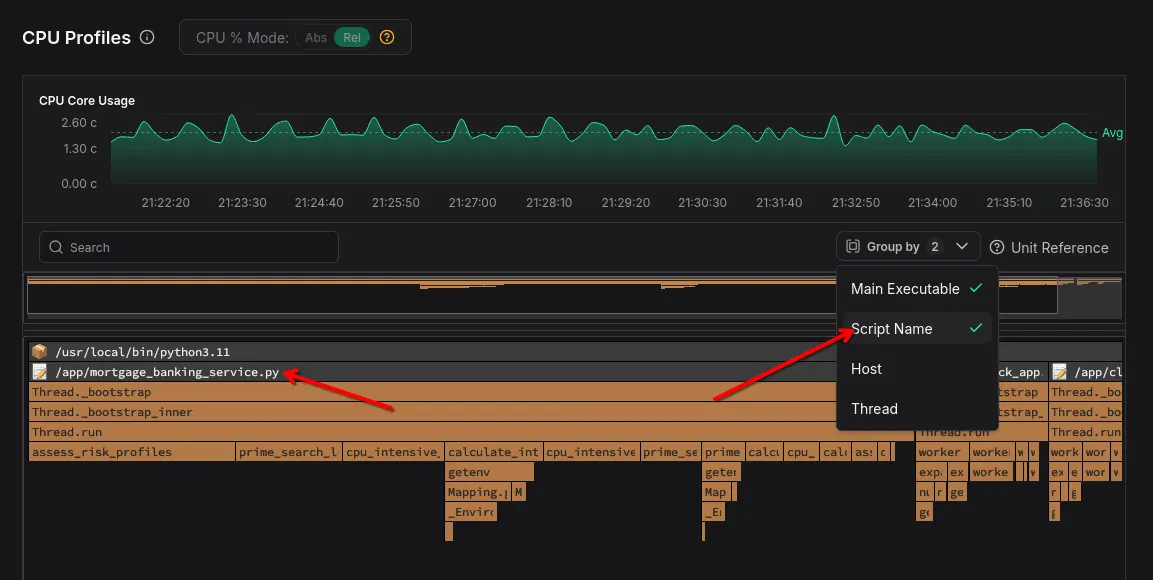
The flamegraph now groups Python traces by their entry point script

Default unit changed from core seconds to cores
We went through various iterations and experiments for the optimal unit to display CPU usage. For the longest time, we went with core seconds — the number of seconds actively spent in a piece of code. This was generally decent, but one thing that constantly annoyed us was that numbers aren’t comparable across different selected time ranges.
For example, if you look at a 30 minutes window in one tab and at 7 days in another, the core time values would vary wildly, and in order to compare them you’d have to account for the time range in your head (or open up a Python REPL which everyone likes to use as their favorite calculator).
We’ve played around with various alternatives, and the one that we eventually settled on is cores. This is similar to core seconds, except that it’s divided by the time range.
We’re very happy with this new unit, as it provides a unit that also happens to
be very intuitive to understand. If a function consumes 200 millicores, that
means on average you’re using 20% of one core on it.
The new unit is also much easier to mentally map to the associated cost, while additionally solving the problem of comparability regardless of the selected time range.
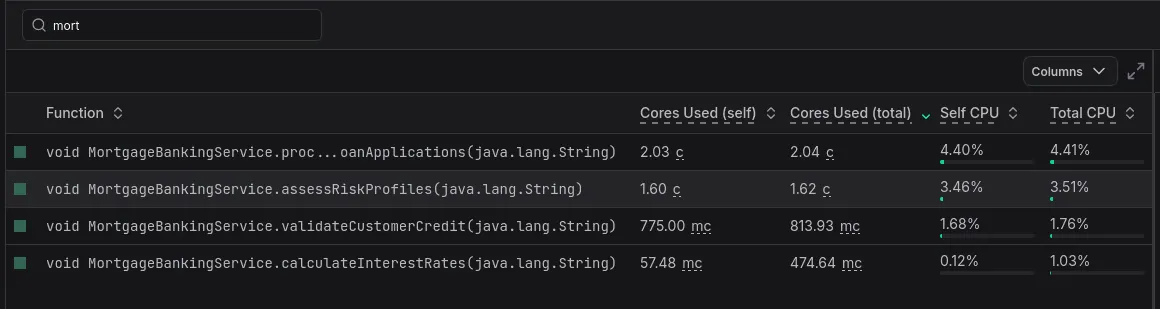
Core unit being used in top function list columns

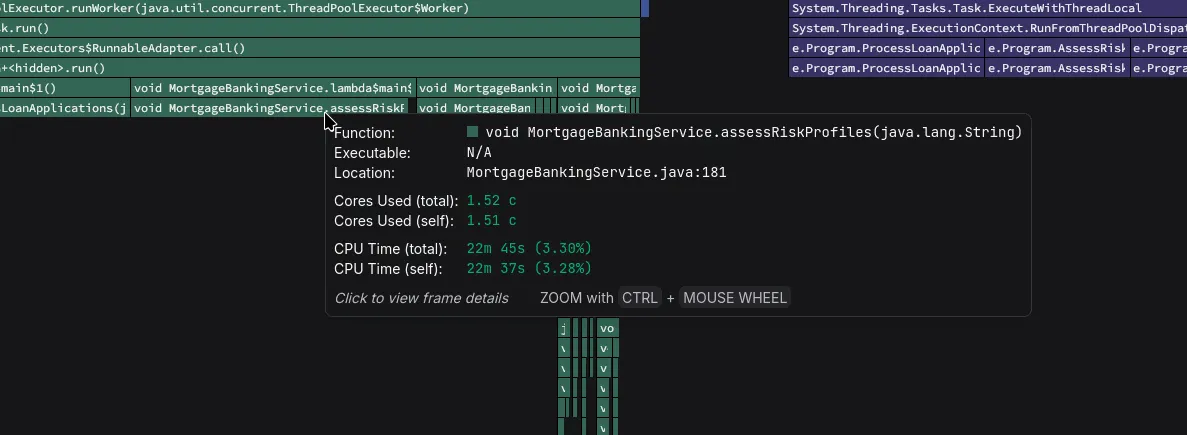
CPU time being shown as "cores" in flamegraph tooltip

zymtrace-profiler performance optimization
The CPU usage of the profiler was already incredibly low for what it is doing to begin with, but some of our customers have challenged us to make it even faster. If you’re running the profiler on many thousands of machines, even a very small percentage of CPU cycles can eventually add up to non-trivial cost!
The convenient thing about building a profiling platform is that you can dogfood it to find optimization opportunities. Based on that, we identified various improvement opportunities in the agent and implemented 8+ changes (both small and large) to reduce CPU usage.
Some of the more impactful changes are listed below.
- We were previously explicitly GCing after each profile export. This keeps average memory use down, but doesn’t really help much since the peaks are roughly the same. We changed this to only run GC every Nth export call. This reduces GC time quite a bit.
- The profiler held various caches in memory in a way that caused extra work during GC scanning: ~700,000 individual objects. We reworked this to turn them into one big object, which is a lot friendlier for the GC to scan through.
- We applied a somewhat large rework of the interpreter symbolization pipeline, building the foundation for and then implementing interpreter symbolization caching on a per-frame basis.1
- We applied tweaks of Zstd compressor parameters used in our network protocol to do compression in larger chunks, significantly reducing cycles burnt.
Running on a 32 core machine, with a sampling rate of 100 (essentially akin to sampling 160 cores at 20Hz), we recorded the following improvements running various workloads:
- JVM renaissance benchmark: -56% CPU time
- PyPerformance benchmark (1 instance): -18% CPU time
- PyPerformance benchmark (12 instances): -25% CPU time
- Mostly idle system: -45% CPU time
On a fully loaded 96 core machine, these improvements bring down our agent’s CPU usage to less than 0.1%!
Sneak peek: Zing unwinding
Some of our customers have asked us for support to profile Azul’s Zing JVM. Zing is a high-performance drop in replacement for OpenJDK maintained by Azul2.
Zing contains many significant changes compared to vanilla OpenJDK, particularly in its internal data structures and memory layout. Most of these are likely optimizations meant to make the runtime itself faster, but it also means that we have to handle them differently during profiling.
While existing tools like async_profiler do support Zing, they take a
different approach than they do for OpenJDK: instead of unwinding directly
from eBPF, they require injecting a library into the target process and calling
Zing-specific functions to perform the unwinding.
We weren’t particularly fond of this approach and wanted to implement native
eBPF-based unwinding for Zing, similar to how we handle OpenJDK. However, this
turned out to be a bit more challenging than anticipated. Zing uses different
index data structures, a different CodeBlob format, and a completely different
debug data layout compared to standard OpenJDK.
The biggest difference is that Zing doesn’t expose vmStructs — a mechanism
OpenJDK provides to describe internal VM data structure layouts to external tools.
These structures are debugging aids that let third-party tools navigate the JVM’s
internal memory layout without hard-coding version-specific offsets.
Without vmStructs, we had to implement our own logic to determine the offsets.
This involved a good amount of trial and error, debugging sessions, and
careful analysis of Zing’s runtime behavior. Azul graciously provided us with a
debug build of the runtime, accelerating the process a lot — thank you!
The good news is that our implementation is working now! We’re currently in the polishing phase, extending unwinding support to more combinations of Zing and JDK versions.
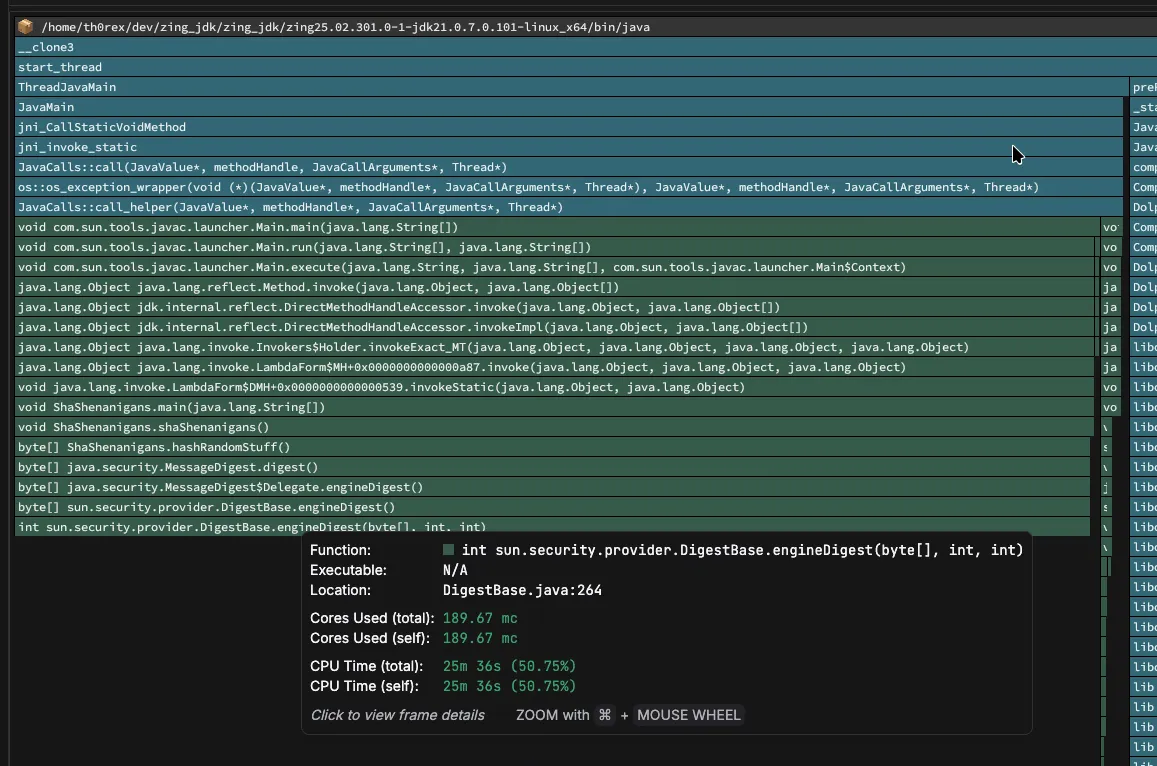
Java demo application running in Zing being profiled

Once finished, this will allow customers to profile Zing-based applications with the same seamless eBPF-based approach that we use for other runtimes. No code changes, no instrumentation, no library injection.
CPU and GPU metrics
We implemented support for providing you with high-level metrics for both CPU and GPU workloads. This deserves a separate blog article, so we wrote one: you can find it here!
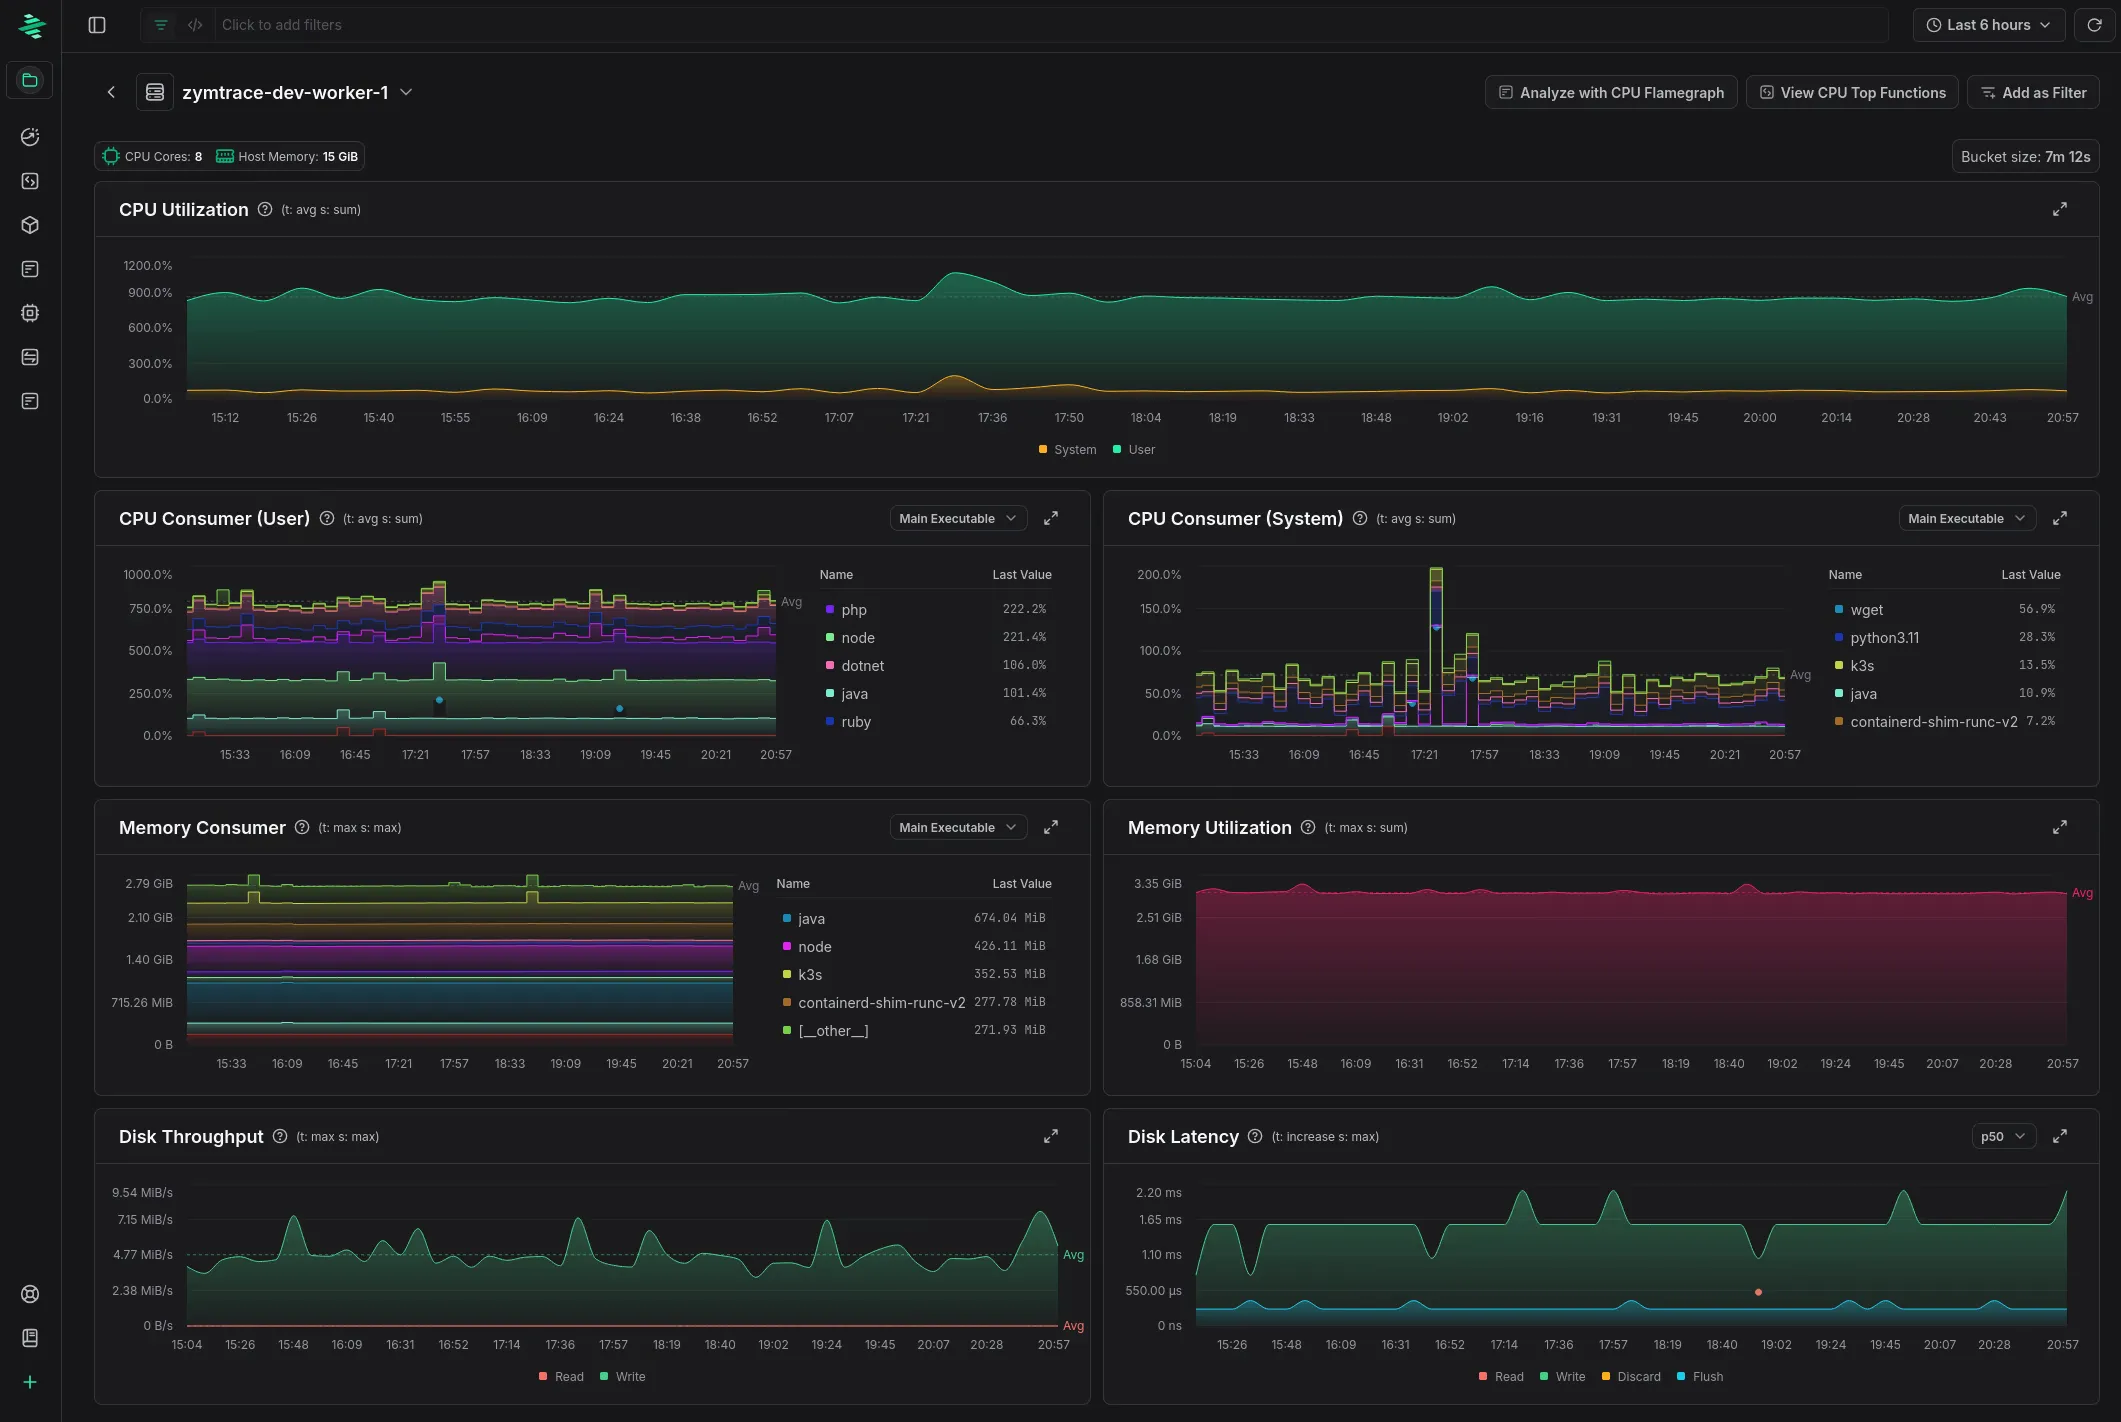
The new host metrics page. Check out the blog linked above for more!

Scaling zymtrace backend
We have worked hard to make zymtrace easy to deploy in small setups while also making it excel in clusters with hundreds of thousands or even millions of cores being profiled into a single backend.
Over the past month we made many improvements to our database schema and sampling queries to ensure a consistently fast experience with as little database compute power and storage as possible.
We also significantly improved the support for customers who want to operate zymtrace backed by ClickHouse Cloud hosted databases. Cloud uses a completely different storage engine than self-hosted distributed ClickHouse: the normal deployments usually run on local NVMe drives while Cloud is backed by object storage. This comes with very different performance characteristics. We have optimized our schema and queries to work well with both of these.
Our storage layer is now optimized enough that we’ve heard reports of people profiling 200k+ cores on a single ClickHouse instance backed by network attached storage. At a 20Hz sampling rate, assuming the profiled cluster is 50% loaded, this translates to more than 2 million stack traces per second being processed and stored on a single database instance!
While we wouldn’t recommend this setup for optimal performance, we continue to be amazed by ClickHouse’s capabilities.
Profiling support for Python 3.13 and 3.14
We were part of the team that created and open-sourced the OTel eBPF profiler, and the zymtrace profiling agent builds on top of it.
While Python 3.13 is officially marked as supported, we noticed that in practice it didn’t actually work correctly for a lot of applications — typically unwinding only one or two frames before giving up.
We investigated this issue and implemented support for changes that were made to Python’s internal data structures in Python 3.13, bringing stack trace unwinding fully back to live again.
With Python 3.14’s release approaching (2025-10-07), we added support for that version as well while we were at it.
We have posted the Python 3.13 fixes for review upstream and intend to do the same for the Python 3.14 support once the former is merged.

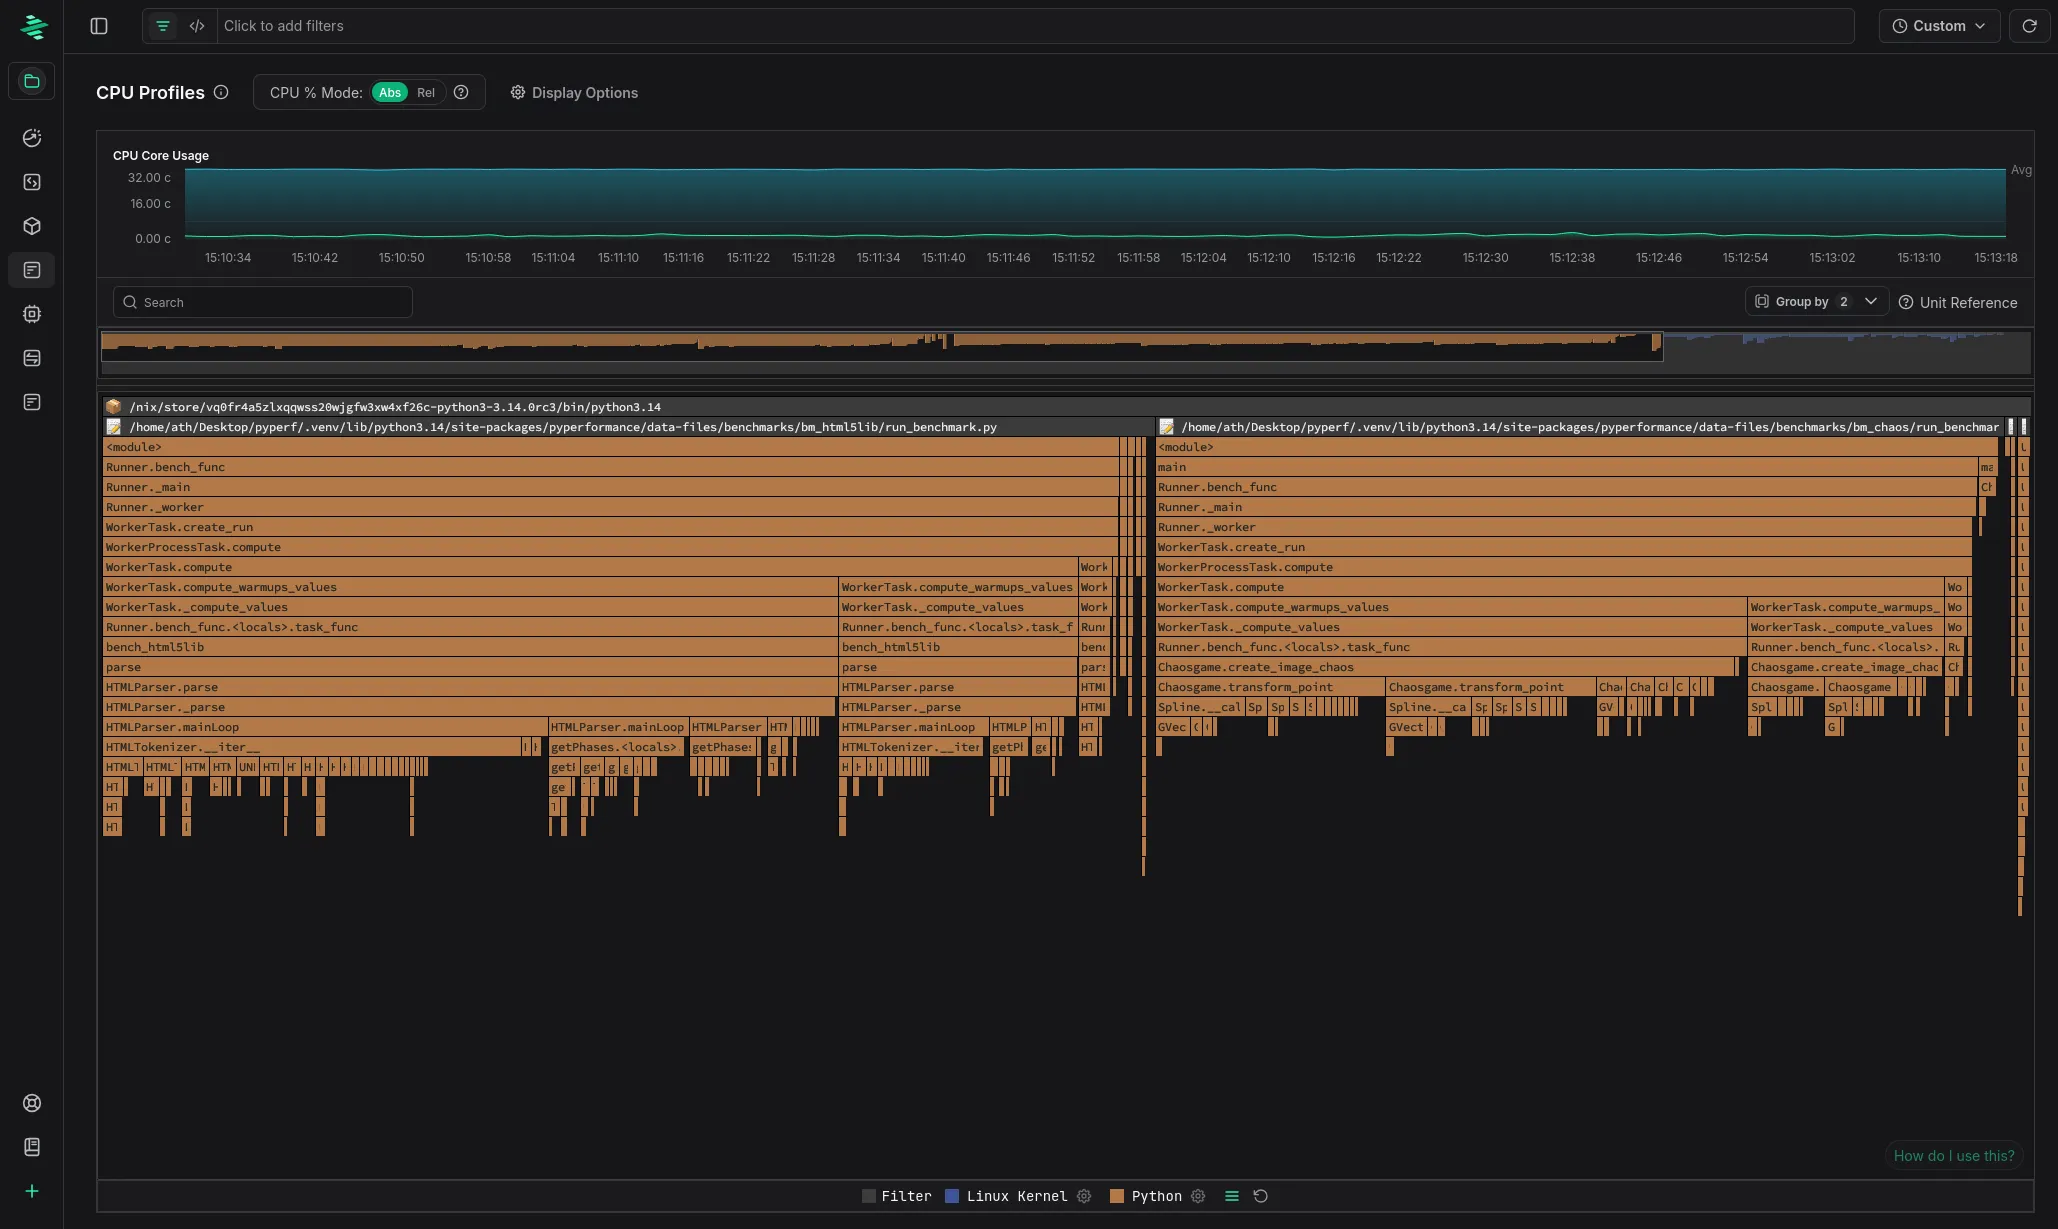
Flamegraph of Python 3.14 running the pyperformance benchmark suite
Sounds interesting?
Get started today at no cost! You can host Zymtrace wherever you want — we provide both Helm charts and Docker Compose configs. If you’re familiar with either, you can have it running within 5 minutes.
Once deployed, the profiling agent automatically profiles everything running on your machines with virtually no overhead. No configuration changes, no instrumentation required. Just run it and watch profiles for all running applications appear in our UI!
For CPU profiling, we support all major languages out of the box — both high-level languages that would otherwise require specialized profilers (Python, Java, Kotlin, Node.js, PHP, Ruby, .NET, and more) and native languages like C/C++, Rust, and Go.
For GPU workloads, we support everything that is built on top of CUDA. This also includes frameworks like PyTorch and JAX.
Footnotes
-
We originally intended to upstream this work, but a very similar change was recently posted for review upstream by Timo Teräs now. ↩
-
Azul and Zing are either registered trademarks or trademarks of Azul Systems Inc., registered in the U.S. and elsewhere. All other trademarks belong to their respective owners. ↩

