Product
Unifying Observability for GPU Infrastructure: Metrics, CUDA Profiles, Insights

Israel Ogbole
20 mins read
•
We’ve now brought metrics and profiles together in zymtrace, giving engineers a complete view of GPU performance. Metrics surface the what—utilization, memory pressure, power draw—while profiles uncover the why at the kernel level.
For most AI/ML engineers, GPU monitoring begins with metrics. They’re widely available through tools like DCGM or NVML, easy to digest, simple to alert on, and provide a quick high-level view of utilization, memory usage, and hardware health. Metrics make it easy to spot patterns—whether Tensor utilization is dropping, GPU memory is maxed out, or power draw is unusually high. But metrics alone stop short: they tell you what’s happening, not why.
That’s precisely why we didn’t start zymtrace with metrics—they were already broadly available. Instead, we began with the hardest and most critical missing piece: profiles. zymtrace distributed GPU profiler provides engineers an always-on kernel-level visibility, exposing inefficient CUDA kernels, stall reasons, and disassembled SASS instructions, all correlated back to the CPU code that launched them - with zero friction.
For example:
- Metrics may show low Tensor utilization → Profiles reveal the inefficient CUDA kernel causing the stall.
- Metrics may highlight low/inefficient GPU utilization → Profiles show the specific CPU function, CUDA kernel, or even SASS instruction responsible.
- Metrics may flag excessive power draw → Profiles explain it by pinpointing inefficient execution patterns or synchronization overhead.
Now we’ve brought the two together in zymtrace. By combining metrics with our deep profiling capabilities, you can correlate high-level signals with detailed kernel analysis. The result is a seamless workflow:
- Metrics: spot anomalies, form hypotheses, and identify potential bottlenecks.
- Profiles: validate hypotheses, explain root causes, and guide optimization.
Together, they close the loop from detection → diagnosis → optimization.
eBPF-powered Host Monitoring
GPUs don’t operate in isolation, they rely heavily on their host CPU. Most GPU bottlenecks happen when the GPU is waiting for the CPU to prepare data, schedule kernels, or handle synchronization.
For this reason, we also added host metrics to zymtrace. Starting with version 25.9.4, the zymtrace profiler automatically collects host metrics via eBPF—enabled by default with near-zero overhead. If CPU utilization spikes while the GPU sits idle, you can drill down into the CPU flamegraph to pinpoint the exact lines of code responsible.
If needed, you can turn off host metrics collection with --enable-host-metrics=false.
With host metrics, you can easily correlate CPU and GPU utilization to identify when GPUs are waiting on CPU-bound operations.

eBPF powered host monitoring
Enabling GPU Metrics
We kept GPU metrics super simple: they’re bundled into the same zymtrace profiler you already use for CPU and GPU profiling. No extra agents, no separate deployments—just opt in with a single flag:
--enable-gpu-metricsInstallation options:
- Helm – add via
--set profiler.args="--enable-gpu-metrics"(docs) - Docker – include
--enable-gpu-metricsin yourdocker runcommand (docs) - Binary – append to your command-line arguments (docs)
- Systemd – add
--enable-gpu-metricsto your service file (docs)
Additionally, zymtrace uses NVIDIA’s NVML (NVIDIA Management Library) to collect GPU metrics. NVML provides a C API for monitoring and managing NVIDIA GPU devices, enabling us to gather real-time performance, utilization, and health data directly from the GPU hardware.
Metrics are collected every 30 seconds and exported every 1 minute by default. You can adjust both intervals to optimize for granularity and cost:
--enable-gpu-metrics --collect-metrics-interval=5s --export-metrics-interval=2mUsing GPU Metrics with GPU Profiles
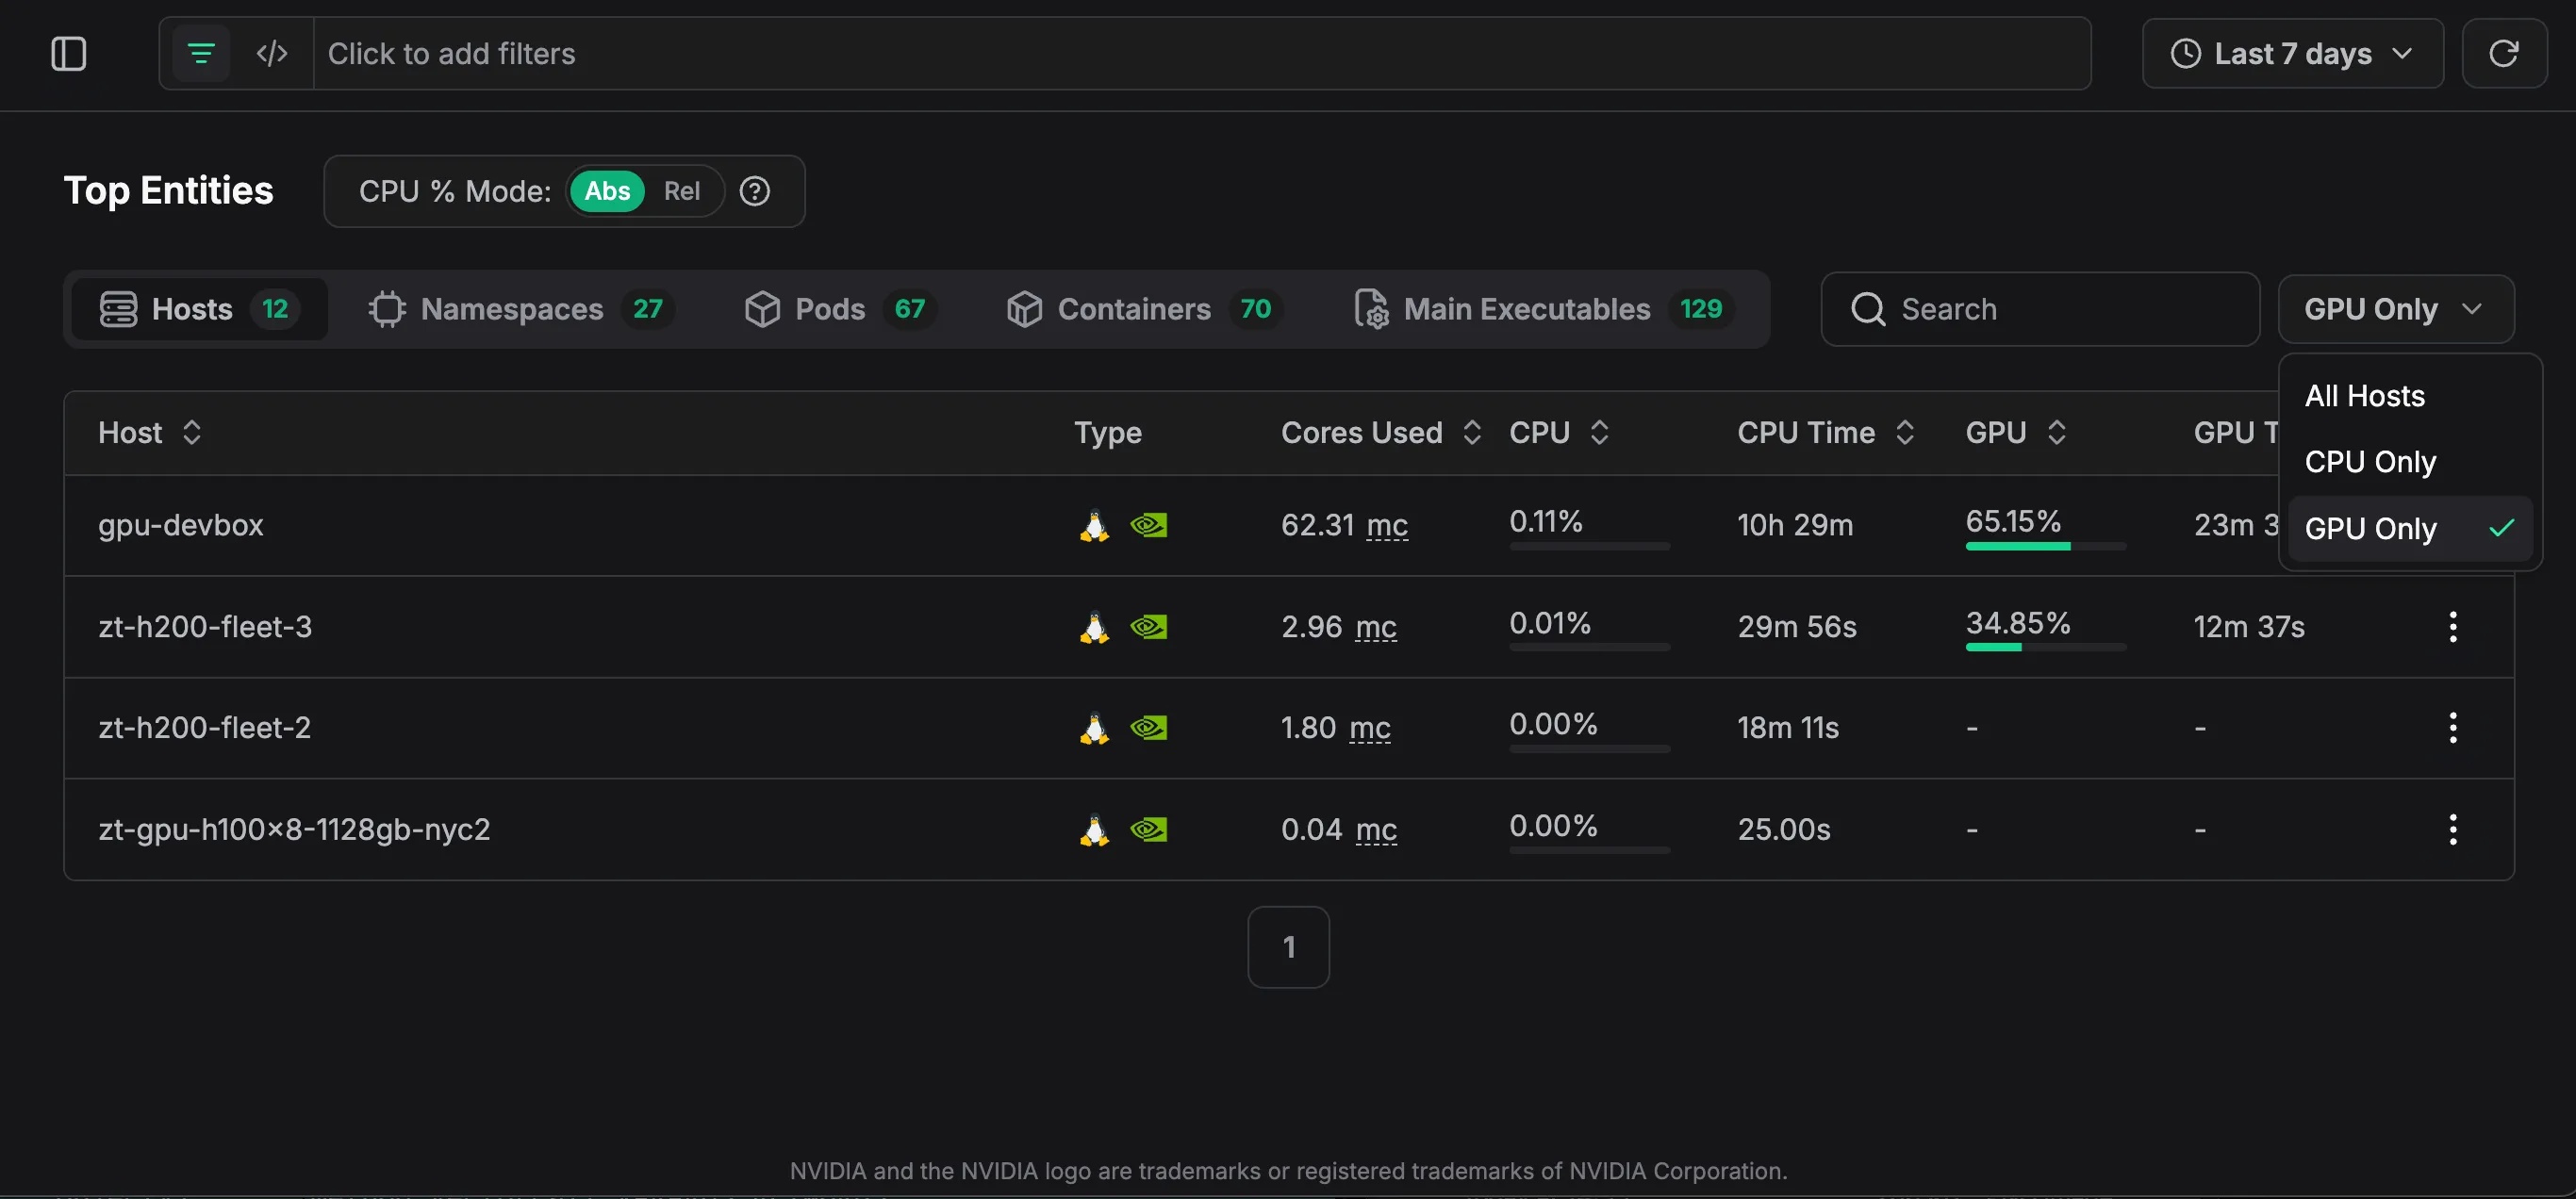
Once GPU metrics are enabled, you can navigate to Top Entities and select your GPU host from the Hosts list view.

zymtrace GPU host list view [click to expand]
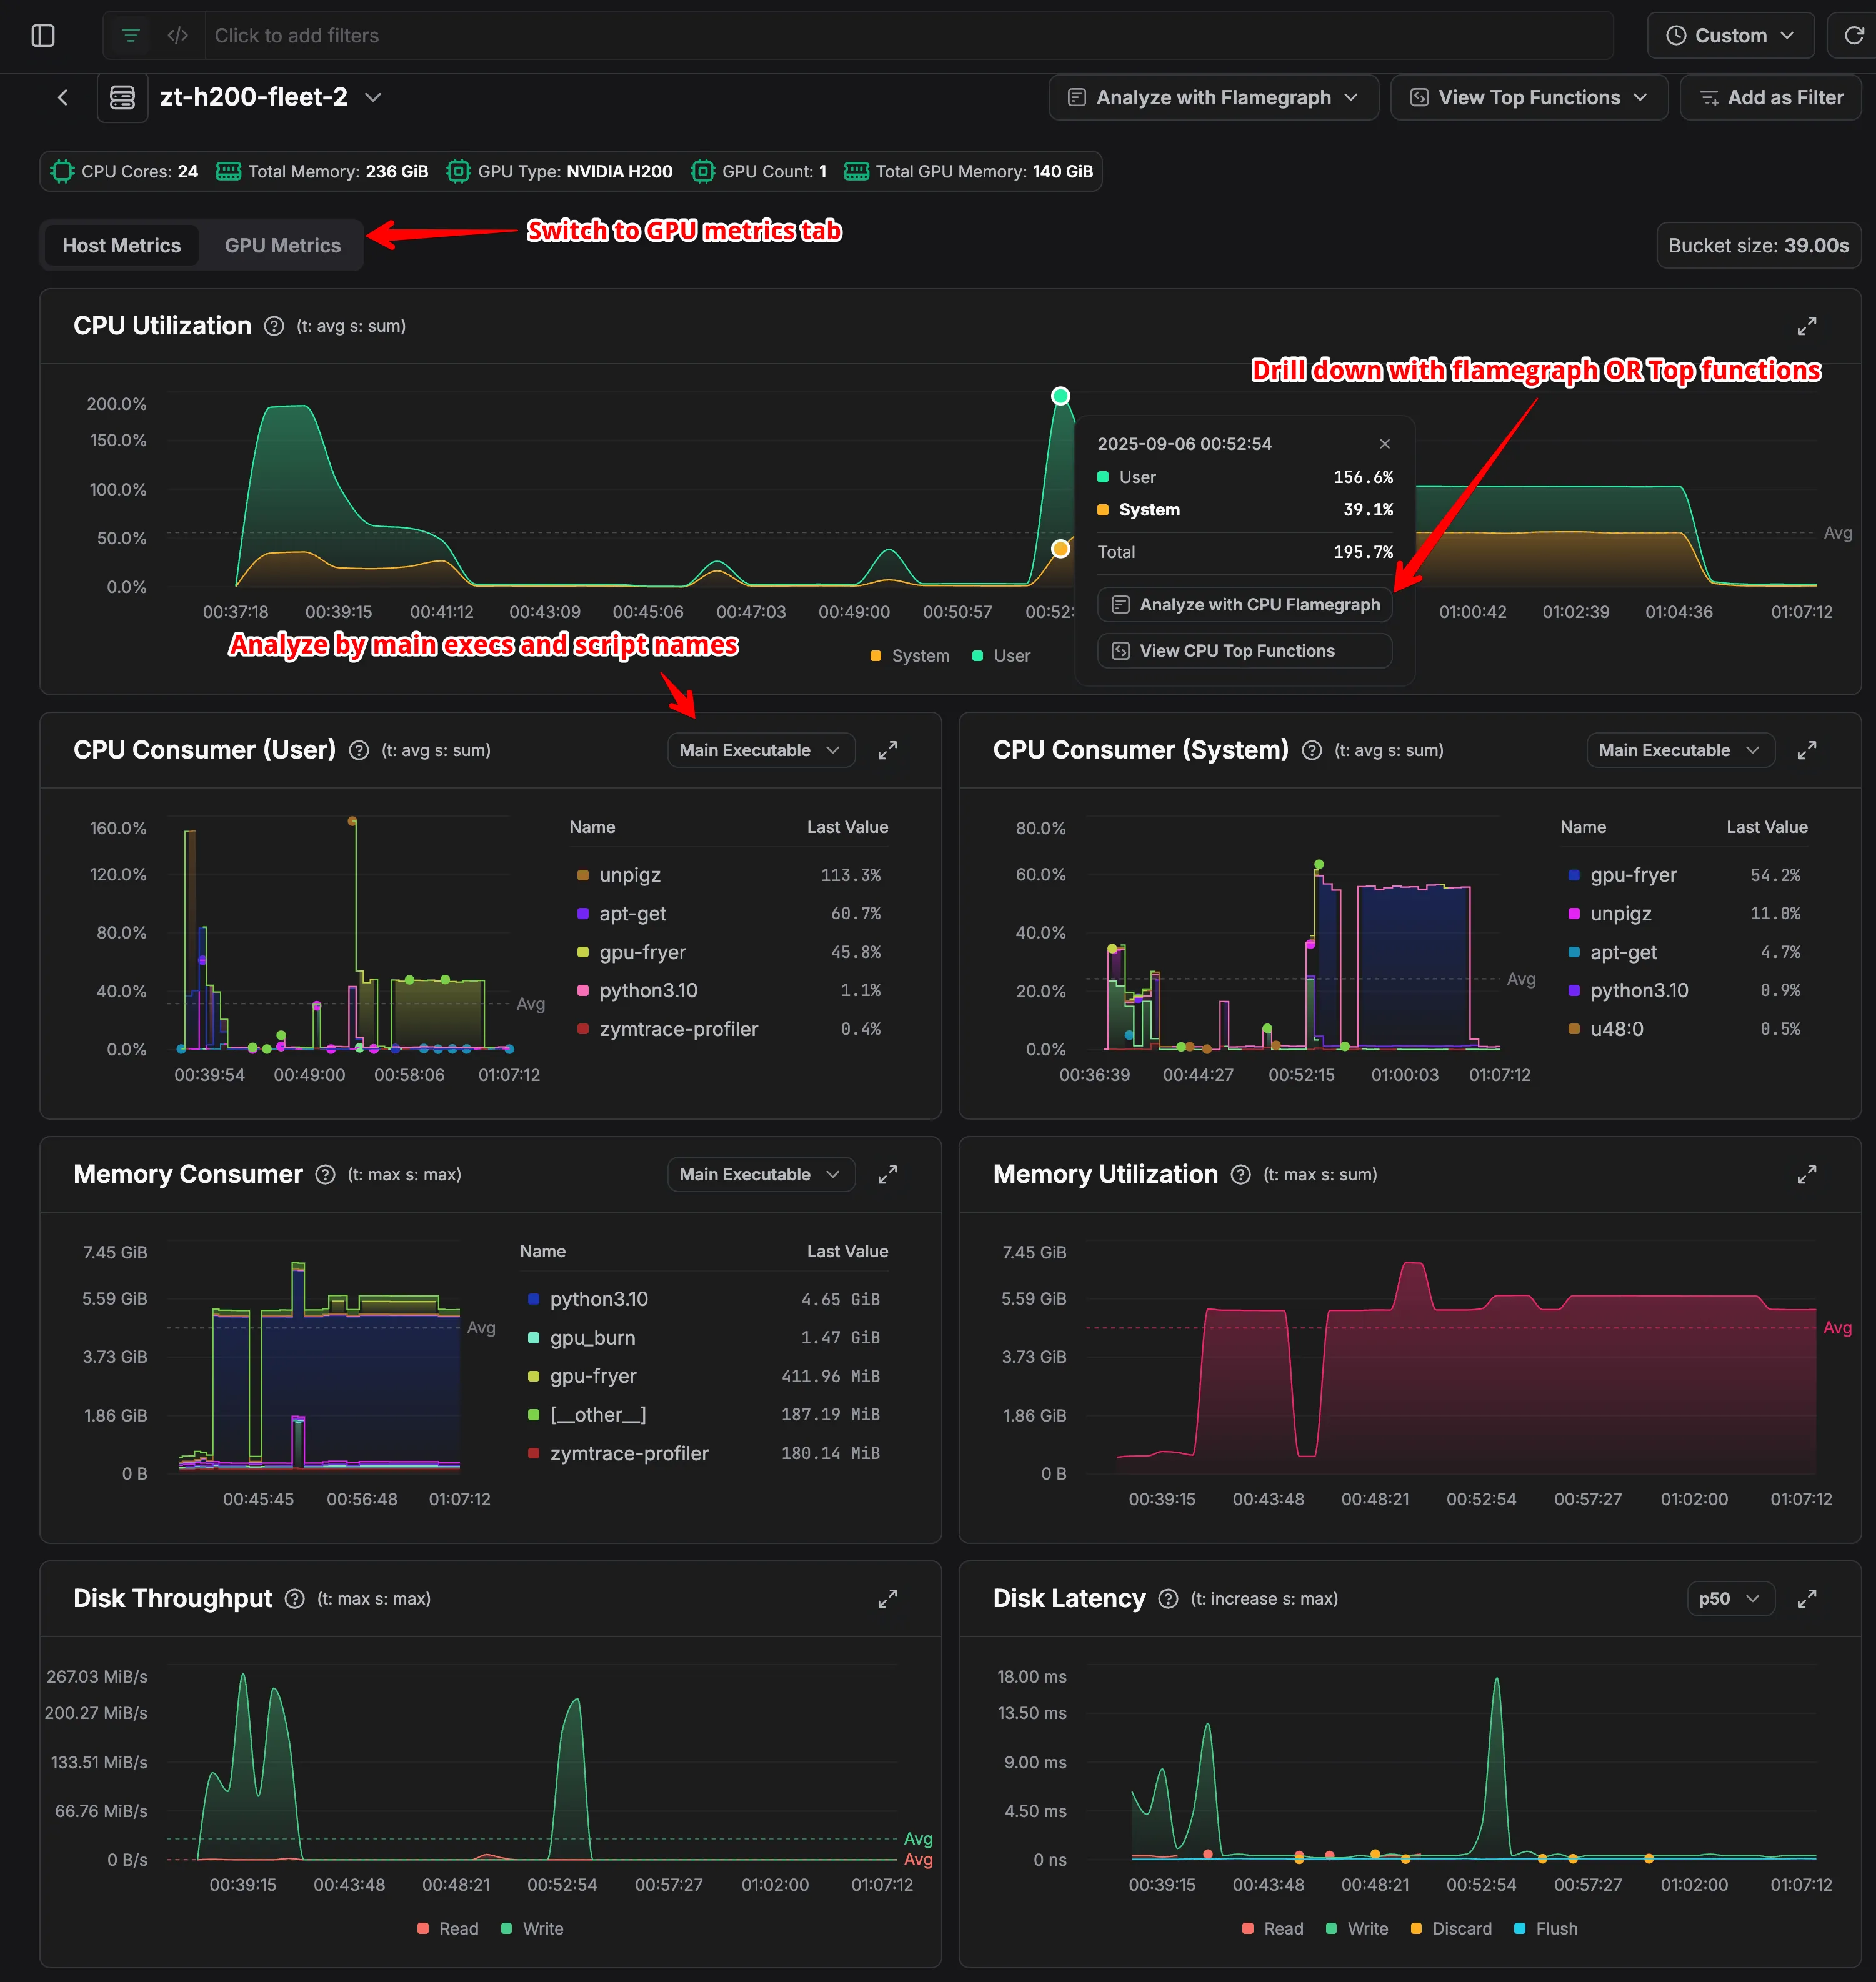
Next, Host Metrics are displayed by default. Switch to the GPU Metrics tab.
This view displays real-time and historical data across all categories, giving insight into patterns in utilization, memory usage, and power consumption. By examining these trends, you can identify anomalies that might indicate performance issues. Clicking on specific data points then allows you to drill down into detailed GPU profiles.
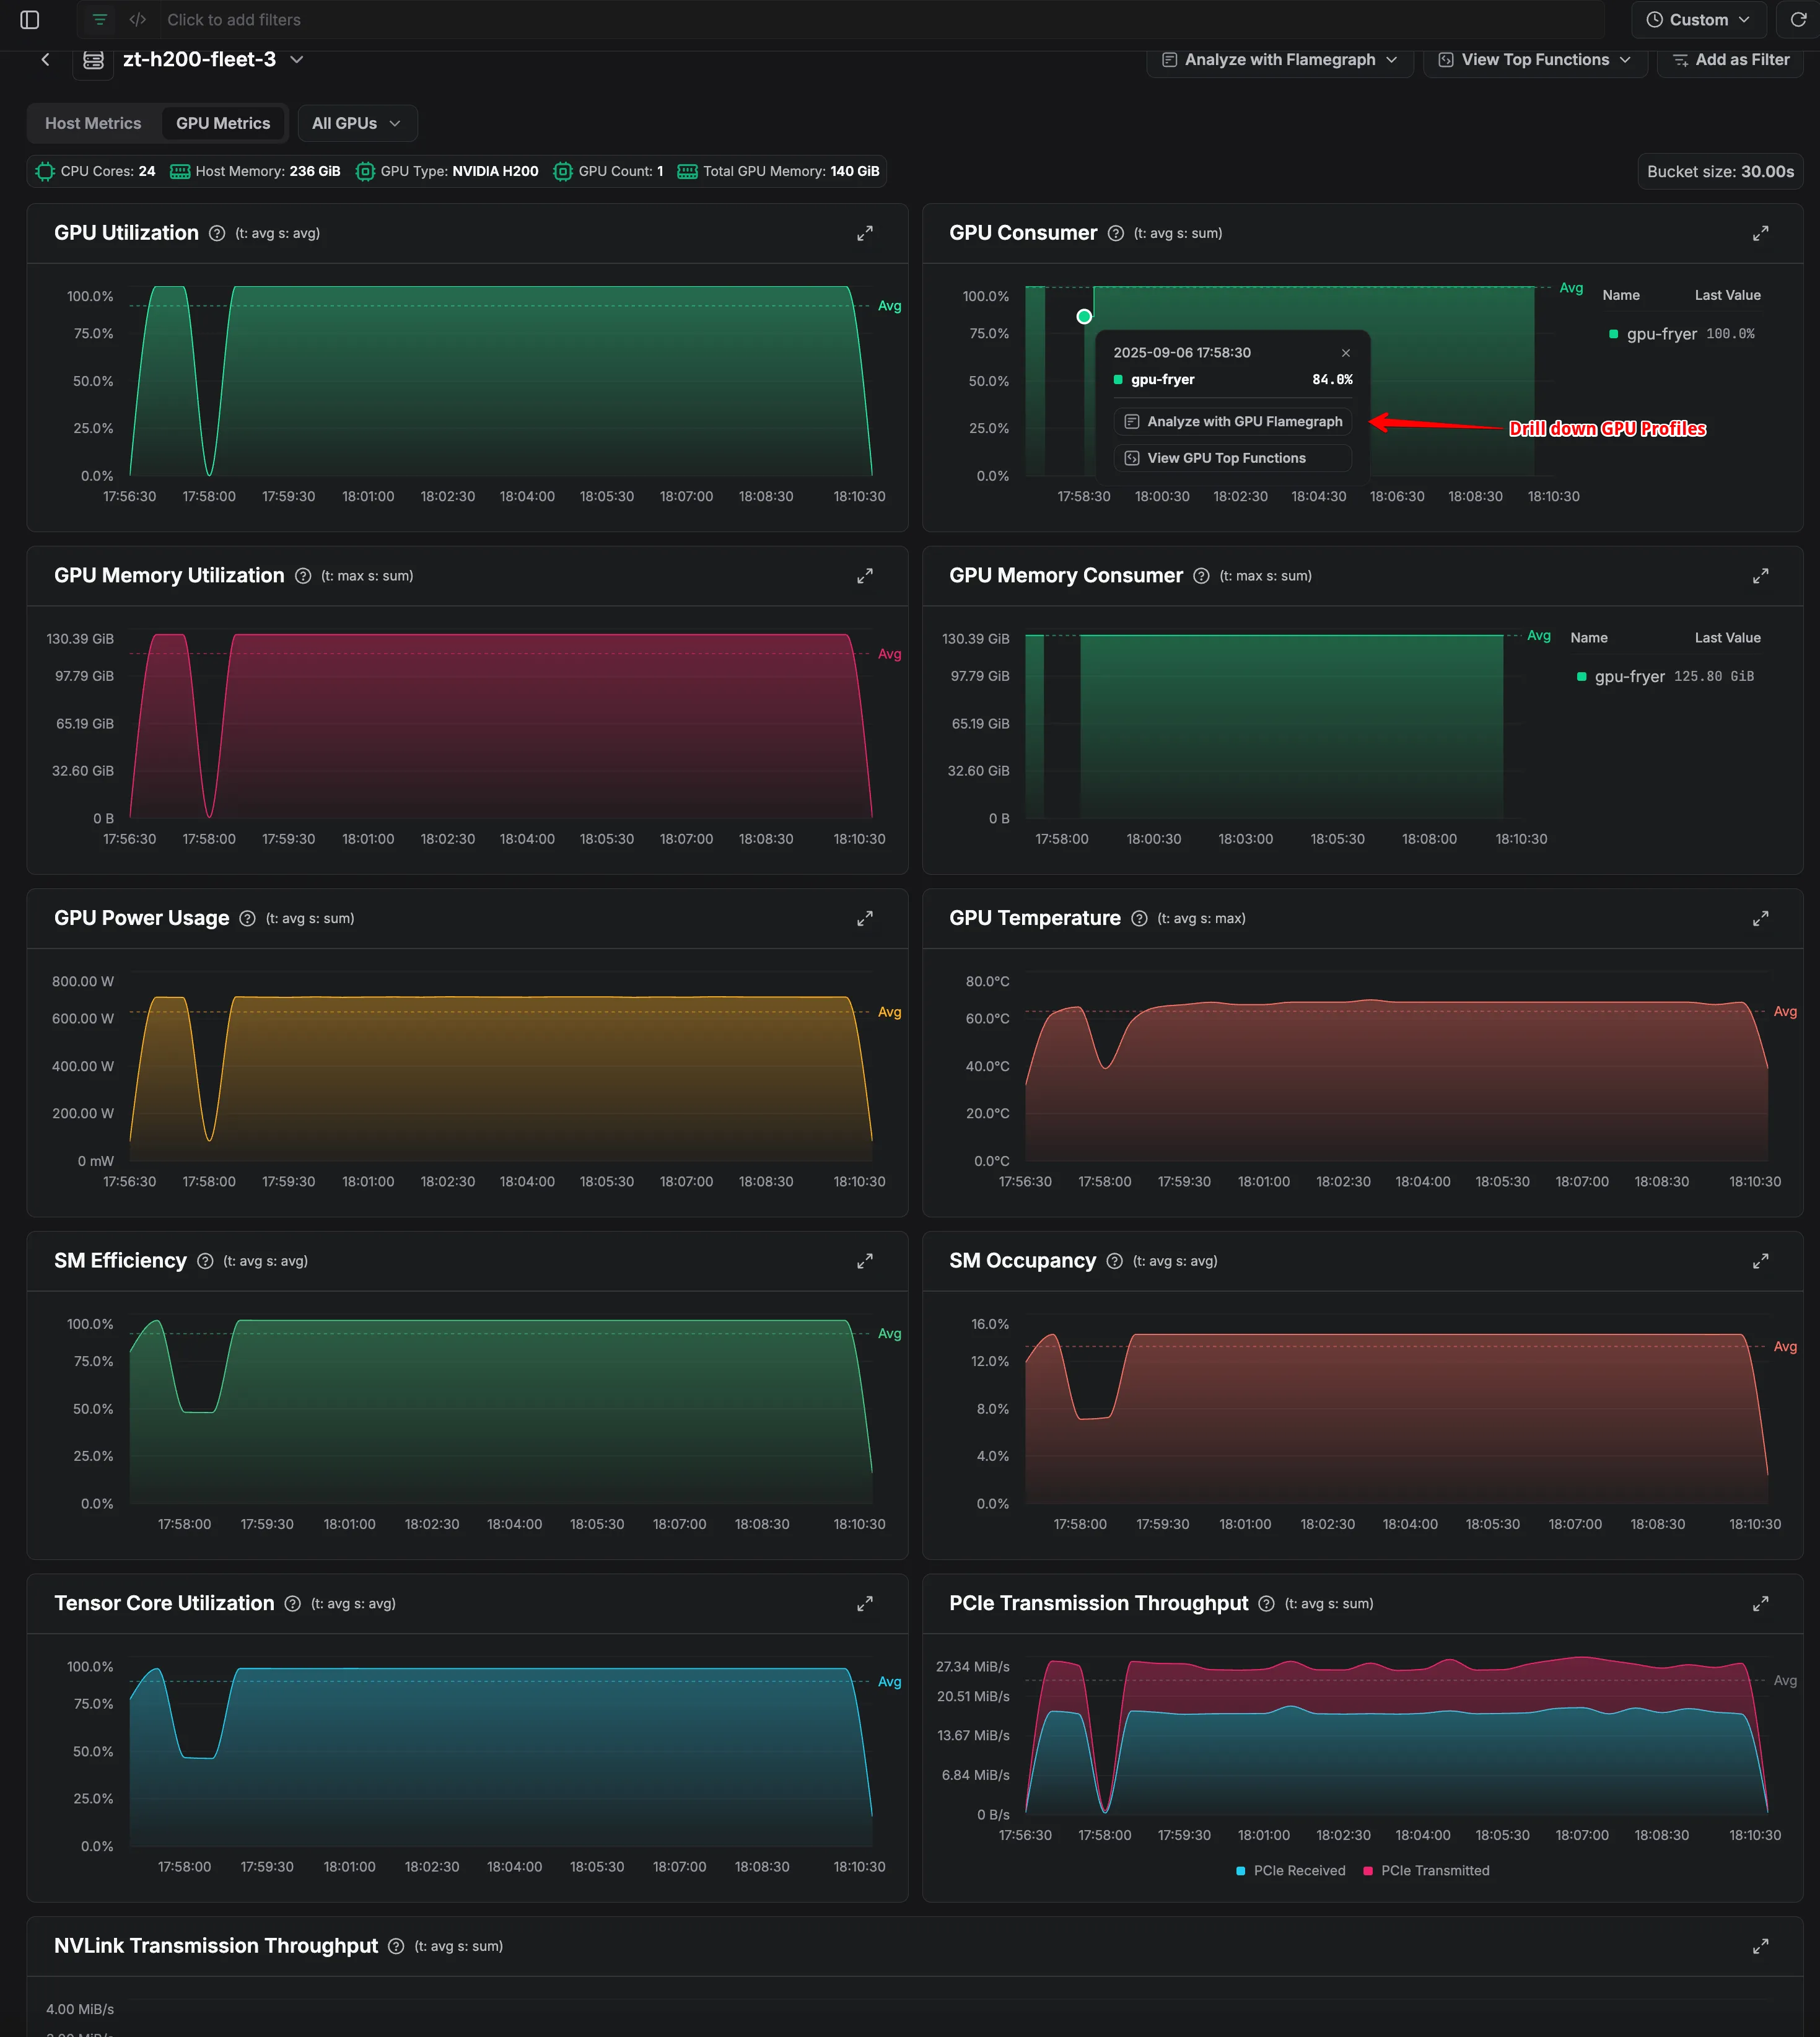
zymtrace GPU metrics [click to expand]

For more granular investigation, the metrics also provide process-level breakdowns. Expanding individual metric widgets shows which processes are consuming the most resources. For example, in our analysis, Hugging Face’s GPU Fryer consumes roughly 90% of available GPU memory. This immediately suggests a hypothesis: high memory pressure could be contributing to performance degradation. Metrics like this guide the investigation toward examining memory allocation patterns and kernel execution characteristics for the process in question.
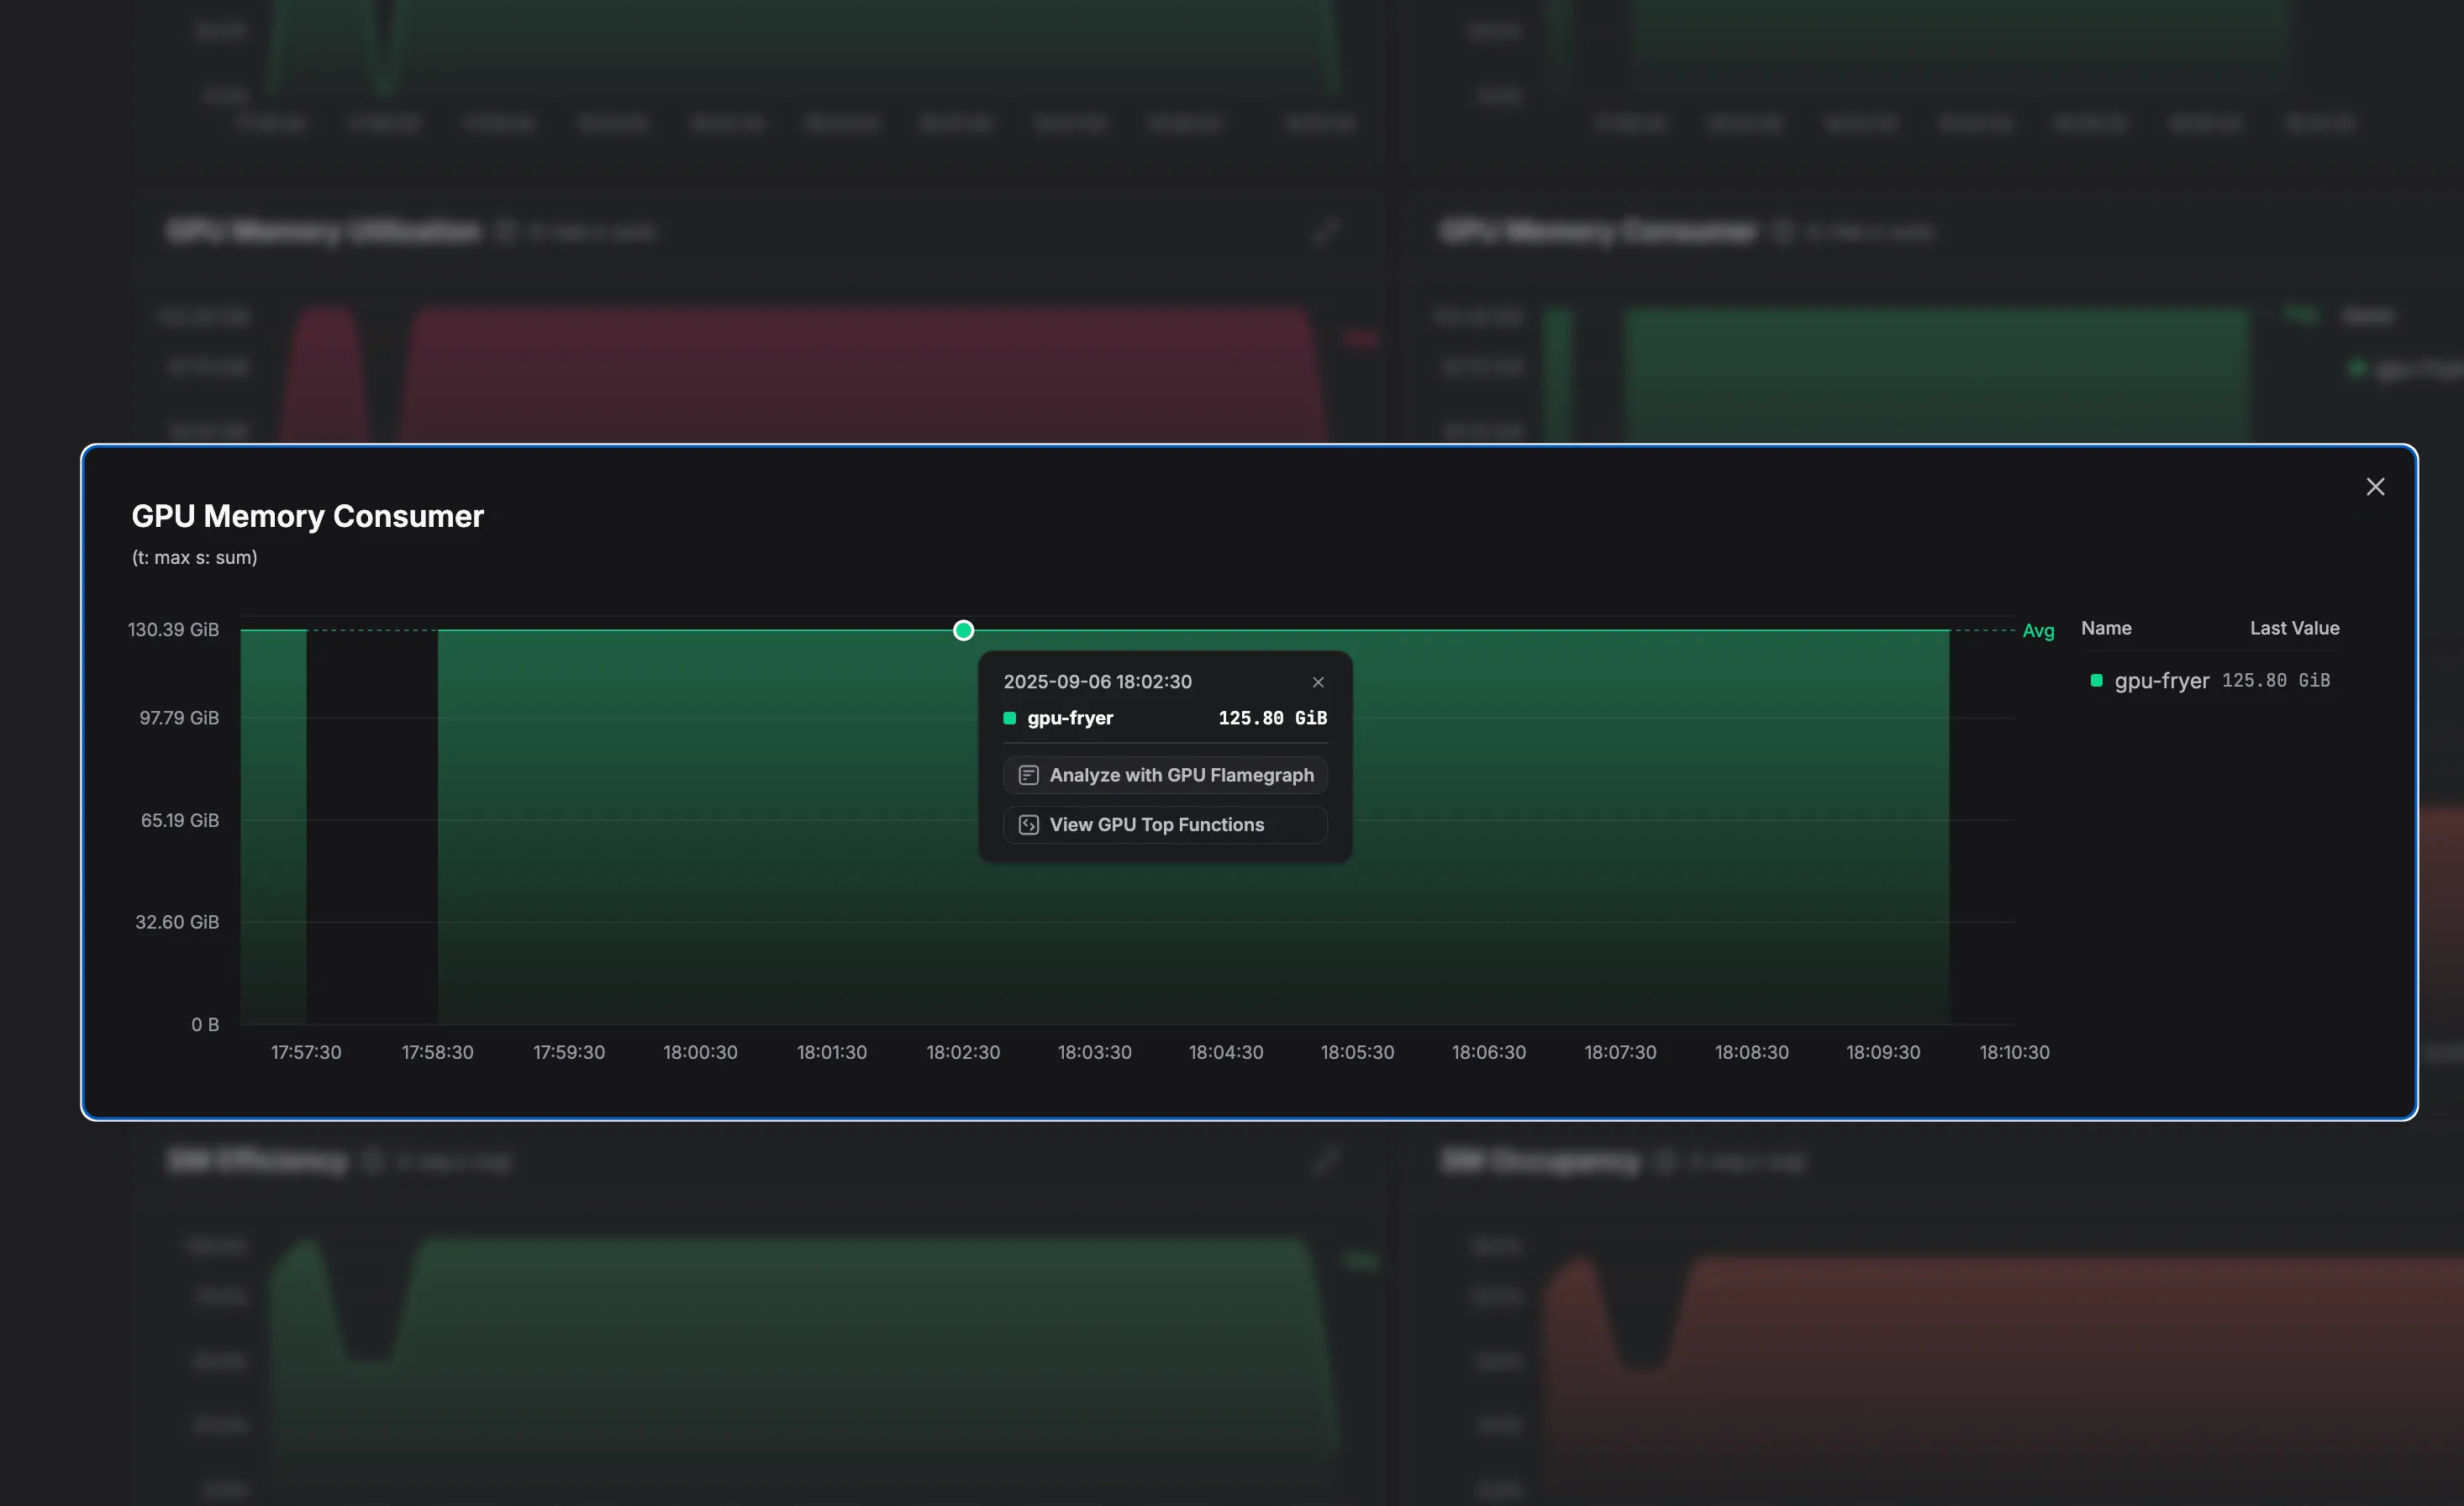
GPU memory consumer breakdown by process [click to expand]

Clicking on the relevant data point, you can analyze the data with GPU profiles. The flamegraph for GPU Fryer, a Rust-based GPU stress-testing tool, shows that it orchestrates asynchronous matrix multiplications through the CUDA runtime.

GPU flamegraph analysis for gpu-fryer process [click to expand]
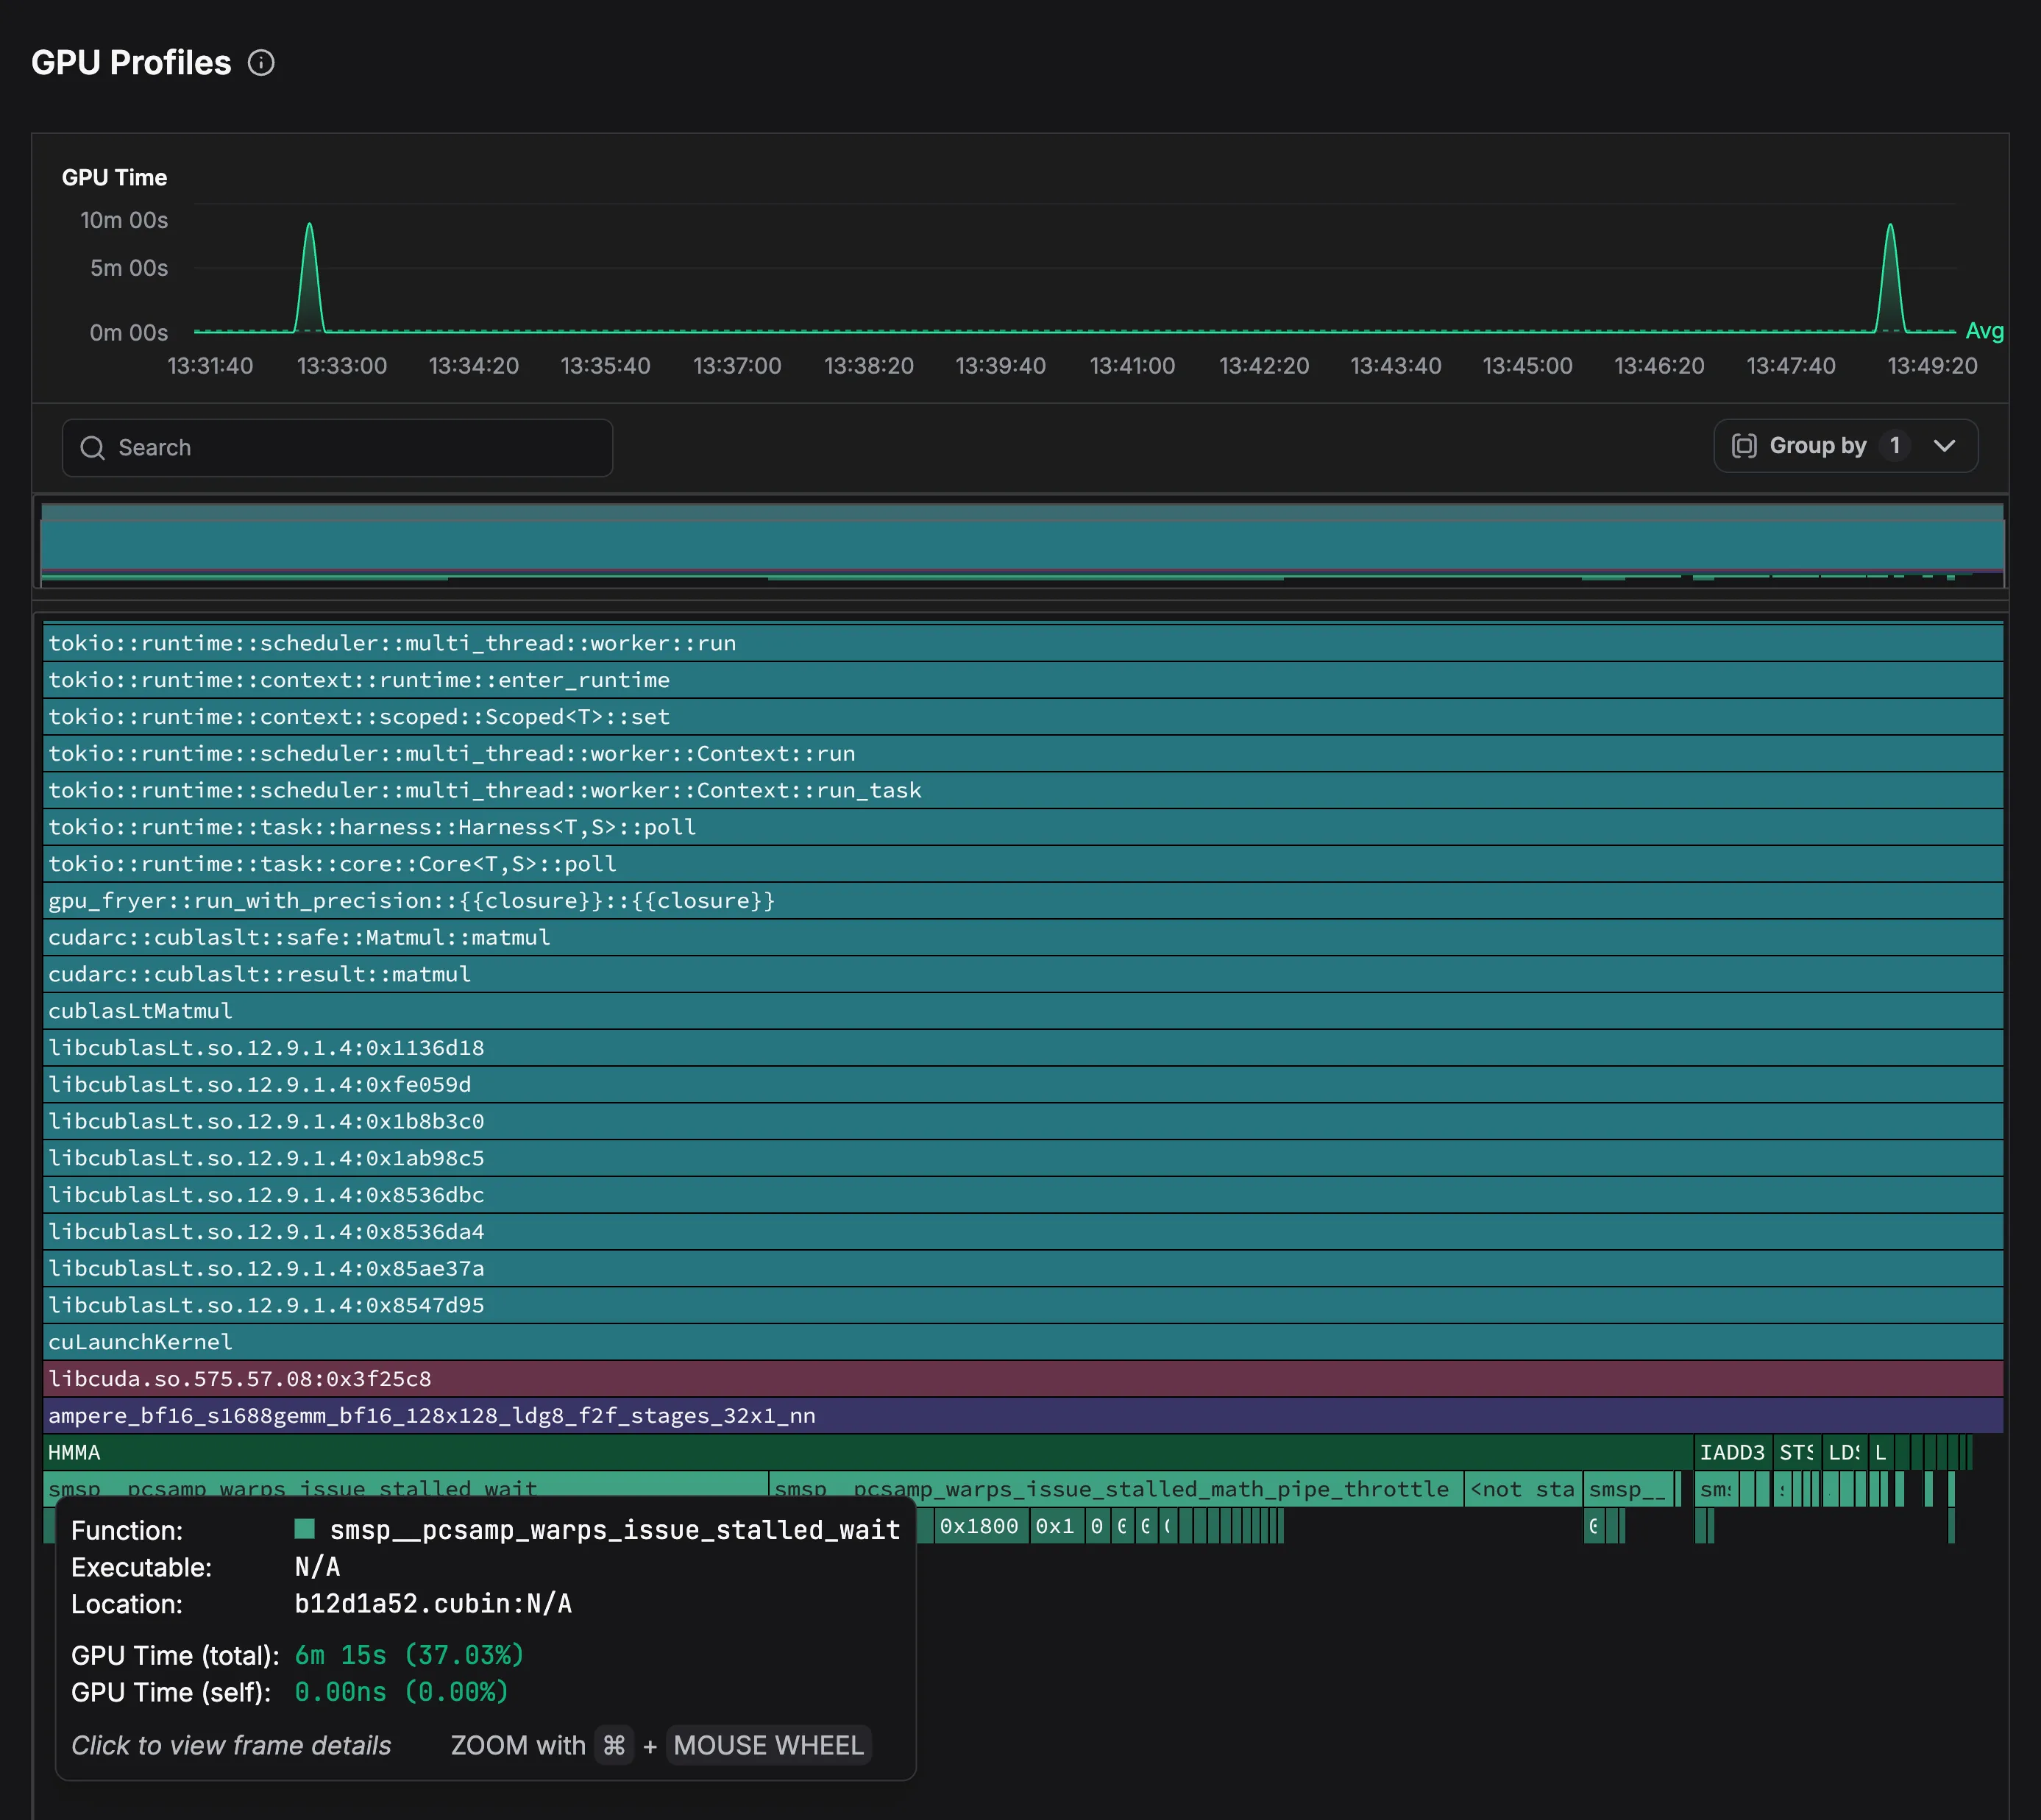
The primary kernel invoked is:
ampere_bf16_s1688gemm_bf16_128x128_ldg8_f2f_stages_32x1_nnThis kernel is launched via cublasLtMatmul from libcublasLt.so and is a batched BF16 GEMM implementation optimized for Ampere Tensor Cores.
At the instruction level, execution is dominated by HMMA (Half-precision Matrix Multiply-Accumulate) SASS instructions, which perform the core fused matrix operations. Scalar instructions such as IADD3 handle indexing, loop counters, and control flow.
The main performance bottleneck is revealed by the smsp__pcsamp_warps_issue_stalled_wait stall reason. This indicates that the kernel is waiting for a fixed latency dependency to complete. In other words: it is waiting for the result of another instruction to be available for the next computation. It generally shows up as top contributor in kernels that are already very well optimized, which is to be expected given that this specific kernel is provided by Nvidia itself as part of cuBLAS. Further optimization may be achieved by reordering instructions in a way that more computation is done while the previous computation is still in progress or switching to lower latency instructions if they are available.
A second stall reason is reflected in smsp__pcsamp_warps_issue_stalled_math_pipe_throttle, which shows that Tensor Core pipelines are heavily utilized but limited by insufficient overlap between arithmetic and memory operations. Even with a 32-stage pipeline designed to hide latency, the number of active warps is sometimes too low to fully exploit the GPU, and scheduler overhead prevents seamless switching to ready warps.
Based on this analysis, several optimization strategies emerge. Improving execution patterns to allow better warp parallelism, refining memory access through a more efficient ring buffer, and adjusting kernel launch parameters to increase occupancy and improve arithmetic-memory overlap can all reduce stalls and boost throughput. Additionally, distributing workloads across multiple GPUs can help alleviate per-GPU memory pressure and further improve performance.
Available GPU Metrics in zymtrace
| Category | Metric | Description |
|---|---|---|
| Performance | GPU Utilization | Percentage of time the GPU was actively processing workloads |
| GPU Consumer | GPU utilization broken down by process (grouped by main executable) | |
| SM Efficiency* | Streaming Multiprocessor (SM) efficiency as a percentage. It represents the ratio of active cycles doing useful work to total cycles, with higher percentages indicating better parallel execution and resource usage | |
| SM Occupancy* | Streaming Multiprocessor (SM) occupancy as a percentage. It represents the ratio of allocated threads to the maximum supported threads per SM, with higher percentages indicating better utilization of available GPU resources | |
| Tensor Core Utilization* | It represents the percentage of time Tensor Cores are actively performing computations, with higher values indicating more efficient use of these AI/ML–optimized processing units | |
| Memory | GPU Memory Utilization | Percentage of GPU memory (VRAM) currently in use |
| GPU Memory Consumer | GPU memory utilization broken down by process (grouped by main executable) | |
| Hardware | GPU Power Usage | Current power consumption of the GPU in watts |
| GPU Temperature | Current GPU temperature in degrees Celsius | |
| Data Transfer | PCIe Transmission Throughput | PCIe data transfer rates between the GPU and system (received and transmitted) |
| NVLink Transmission Throughput | NVLink data transfer rates between GPUs (received and transmitted) |
* Available only on data center GPUs (H100s, H200s, etc.)
Please refer to the understanding GPU metrics section in the doc for details.
Bringing It All Together
Effective GPU performance analysis requires correlating CPU behavior, GPU utilization, and kernel-level execution.
With zymtrace, GPU infrastructure observability is unified. Metrics surface patterns, highlight anomalies, and help formulate hypotheses, while CPU and GPU profiles provide the detailed insights needed to answer the crucial question: why performance behaves as it does.
This integrated approach closes the loop from detection to diagnosis to optimization, turning data into actionable insights and enabling engineers to maximize GPU efficiency and overall system performance.


