Product
News
Unlocking Efficient AI: zymtrace distributed GPU Profiler, now publicly available
Israel Ogbole
Joel Höner
12 mins read
•
Identify performance bottlenecks in CUDA kernels, optimize inference batch size, and eliminate idle GPU cycles —with zero friction.
GPUs are essential for training and inference at scale. Organizations are investing millions into GPU clusters—not just in hardware acquisition, but also in the electricity required to power and cool them. Yet, despite this massive investment, an inconvenient truth persists: GPU utilization remains alarmingly low across the board.
This inefficiency isn’t just a technical oversight—it’s a massive economic drain. Underutilized GPUs lead to longer training cycles, costly inference, and wasted energy. At the heart of the problem is the lack of fleet-wide, production-grade continuous GPU profiling—existing solutions remain intrusive, fragmented, and often blind to the critical interactions between hosts and GPUs.
At zystem.io, we set out to change that. Since launching zymtrace in December 2024, we’ve been working closely with design partners to validate, build, and deploy a distributed GPU profiler purpose-built for modern heterogeneous workloads. Now running successfully in multiple enterprise environments, we’re excited to publicly launch the zymtrace GPU Profiler—a lightweight, production-grade, continuous profiler that delivers the visibility needed to unlock full GPU potential.
With zymtrace, AI/ML engineers can seamlessly trace GPU performance bottlenecks—whether kernel stalls, memory contention, or scheduling delays—directly back to the PyTorch code, CUDA kernels, native functions, or scheduler threads that triggered them. All with zero friction.
Why we built zymtrace: Closing the GPU observability gap
The zystem founders were part of the team that pioneered, open-sourced, and donated the eBPF profiling agent to OpenTelemetry. Our effort helped bring low-overhead, continuous CPU profiling to the community, and today it’s used widely across the industry.
During that journey, we saw the next frontier emerge: The future of compute is undeniably heterogeneous. Modern compute is no longer solely CPU-centric. Enterprise workloads increasingly rely on GPUs and AI accelerators, distributed across cloud platforms and on-prem. Yet observability tooling hasn’t kept up.
Existing observability tools still treat GPUs as black boxes—offering only the most superficial NVIDIA-provided metrics. NVIDIA Nsight Compute provides good code introspection but comes at a steep cost: heavyweight, intrusive, clunky interfaces and outputs that practically require a PhD in GPU architecture to decipher. Other continuous profiling vendors market ‘GPU profiling’ that’s really just basic NVML metrics—showing utilization percentages without revealing what’s actually happening inside your code. The result? Chronically underutilized GPUs, ballooning AI costs, and wasted electricity.
What makes zymtrace different?
zymtrace was engineered from first principles to profile GPUs without friction, applying the same low-level system engineering excellence that made the now OTel eBPF Profiler the industry standard.
Our mission for zymtrace is simple but bold: Unlike anything else available, zymtrace GPU profiler builds stack traces—from high-level PyTorch ops and user-space libraries through native code and CUDA kernels, all the way down to the Linux kernel. We go even deeper, capturing GPU instruction mnemonics, GPU stall reasons, and memory offsets, and correlating them back to the exact CUDA kernel function that triggered the execution, unearthing microarchitectural inefficiencies in AI workloads.
🚀 The zymtrace GPU profiler is already deployed across customer environments, providing insights into AI workloads running on multiple NVIDIA GPUs. You can get started here.
What truly sets zymtrace apart is its ability to correlate GPU traces with the exact CPU code paths that triggered them. Whether you’re running custom PyTorch models or serving inference via vLLM, Ollama, or llama.cpp, zymtrace creates a unified view that connects accelerator execution with host orchestration logic—bridging the gap that has historically made GPU optimization so challenging. Let’s reveiew an example.
DeepSeek-R1-Distill-Qwen execution on vLLM
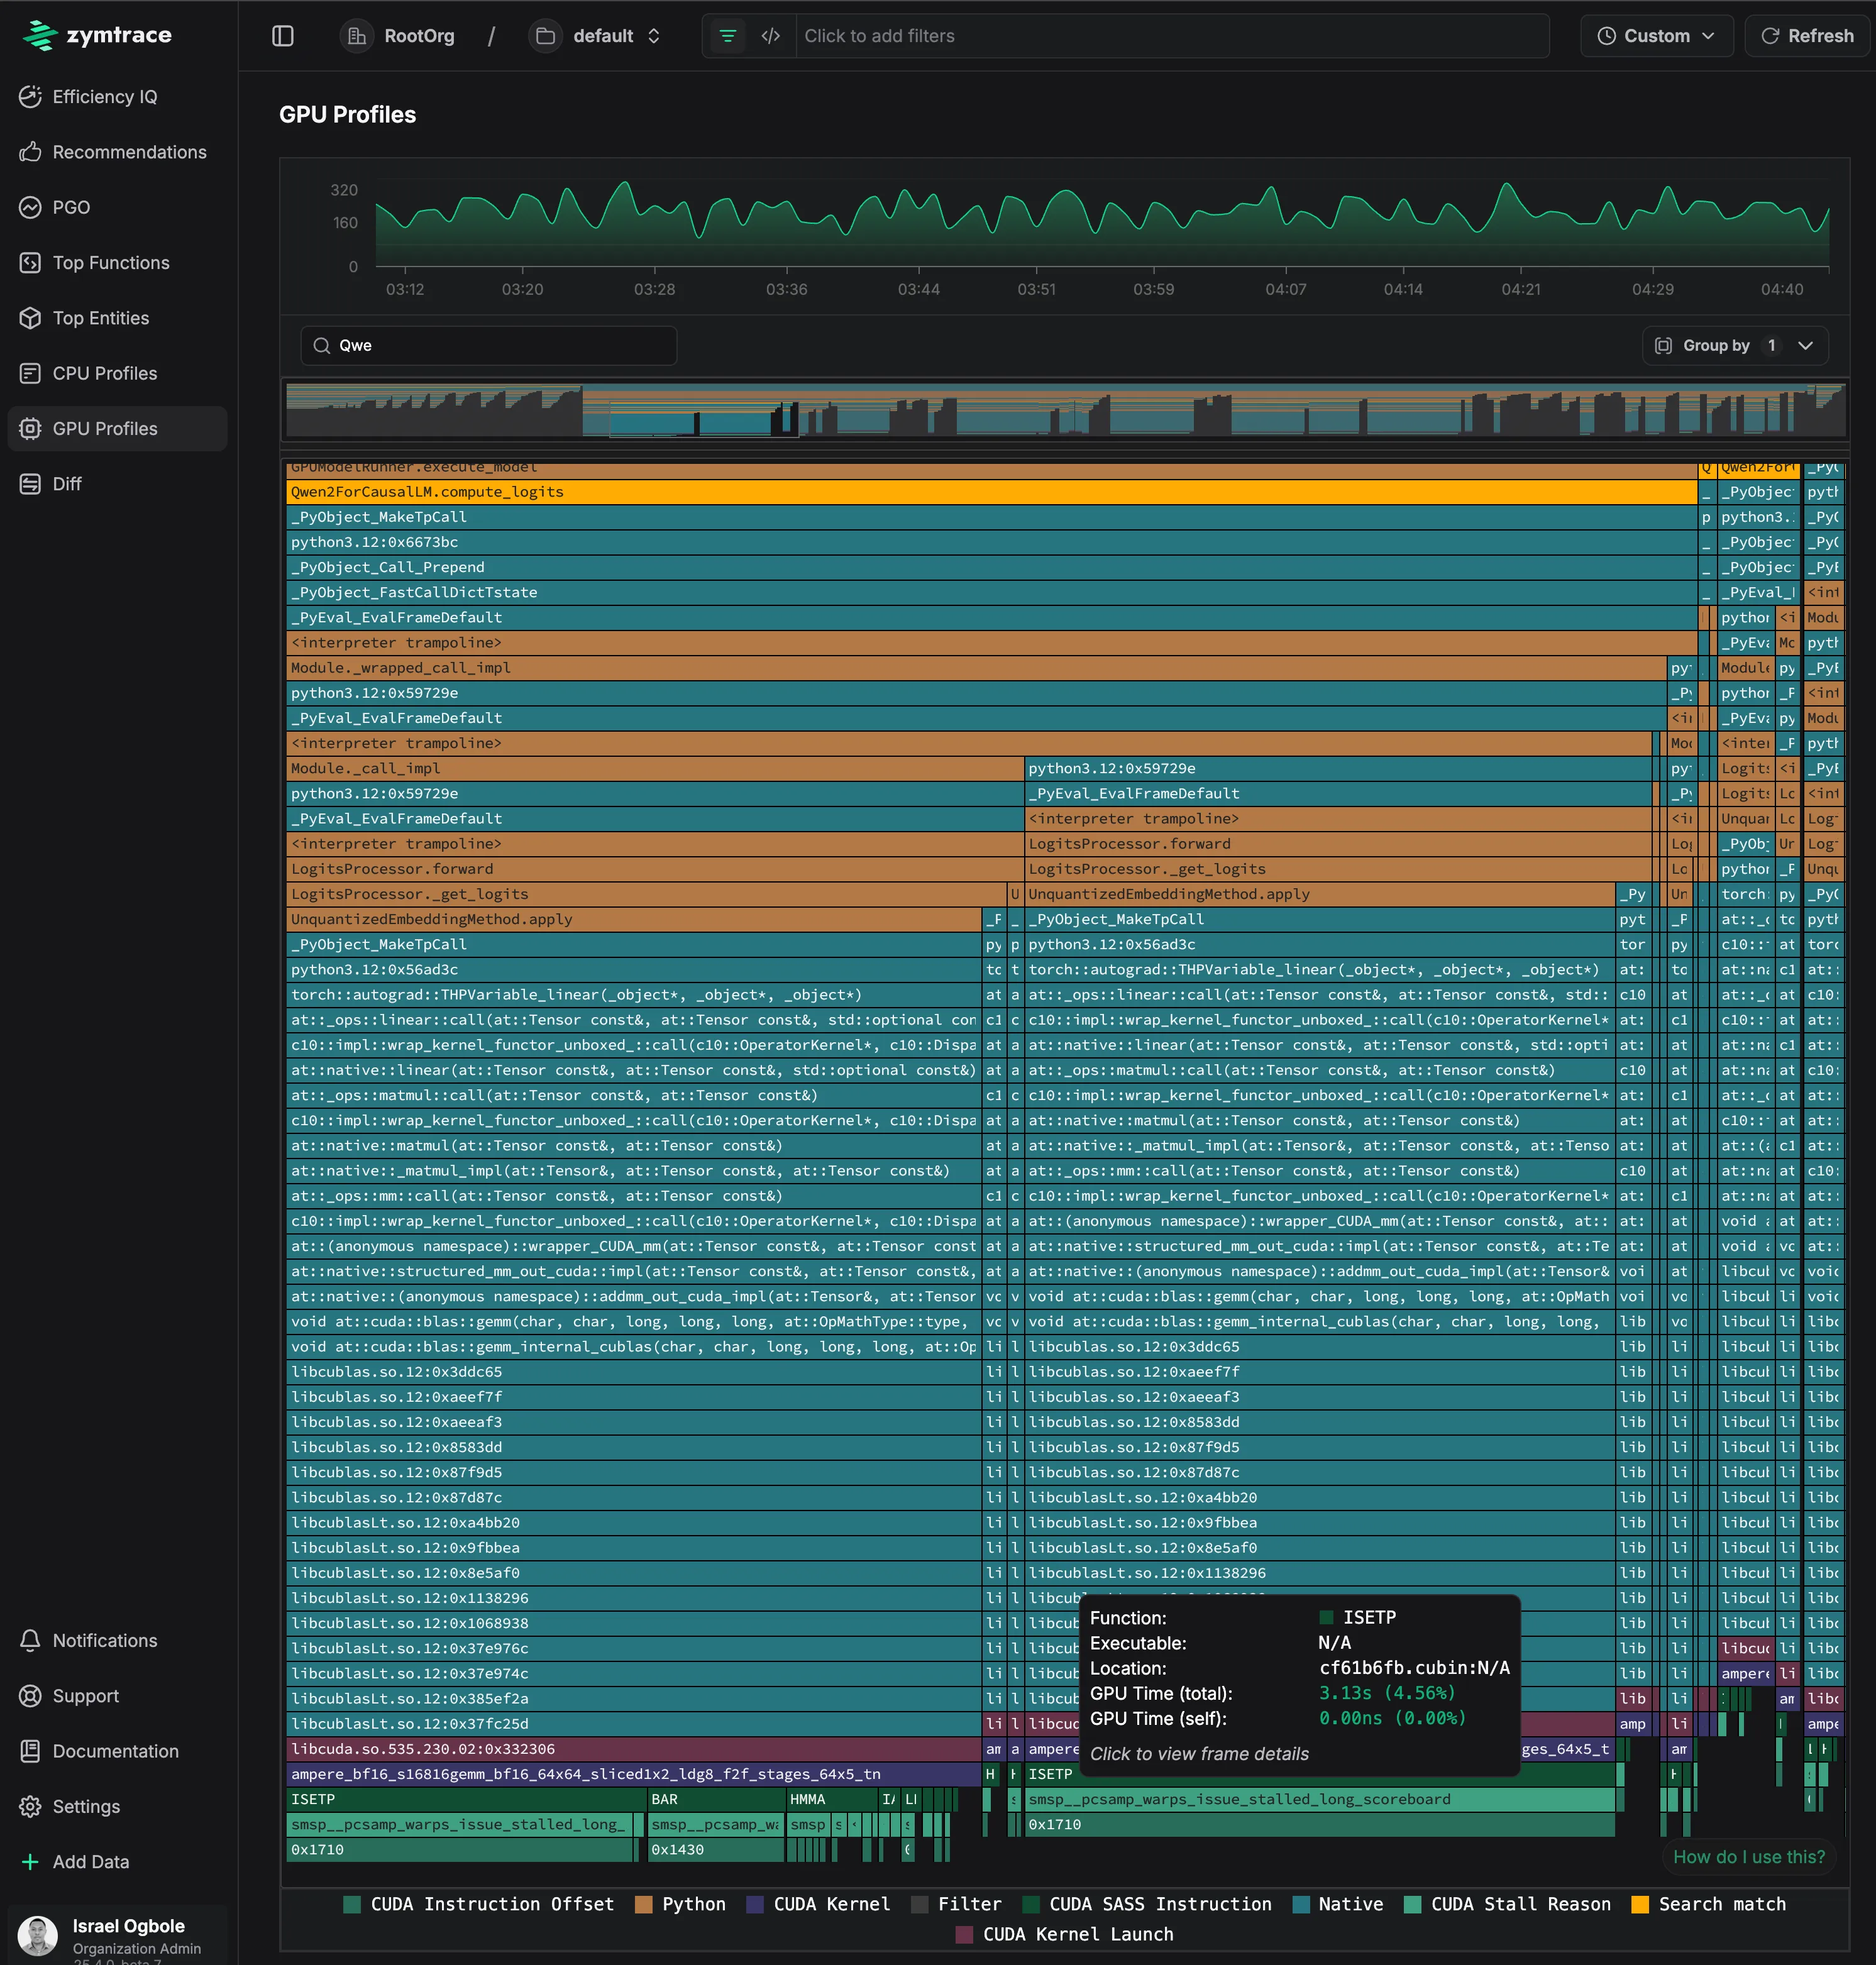
zymtrace enables AI/ML engineers to trace the entire execution path of the inference pipeline — seamlessly following operations from CPU to GPU and uncovering performance bottlenecks along the way. The flamegraph above captures a complete inference pass using the DeepSeek-R1-Distill-Qwen-1.5B model via vLLM, providing end-to-end visibility with zero-friction.
The most revealing part is at the bottom of the flamegraph, which shows the actual GPU instruction execution breakdown. The execution is bottlenecked on ISETP (Integer Set Predicate) instructions, with additional time spent in BAR (warp synchronization barriers). The stall reason (smsp__pcsamp_warps_issue_stalled_long_scoreboard) at addresses 0x1710 and 0x1430 indicates memory-related stalls where GPU warps are waiting for data dependencies to resolve.
This level of whole-system visibility leaves you with no blind spots. Stay tuned for a more in-depth analysis workflow blog soon, where we compare performance of inferences and tweaks to optimize the performance - measuring before and after results with zymtrace.

zymtrace AI flamegraph execution flow
Three GPU optimization questions zymtrace helps you answer, fast
zymtrace is purpose-built to squeeze every bit of performance from your GPUs, especially in inference-heavy pipelines, helping ML and infrastructure teams do more with fewer GPUs by answering three key questions, fast.
1. How can I optimize CUDA kernel launches?
GPUs execute operations in units called “kernels.” Each kernel launch introduces extra latency because the GPU sits idle while waiting for the CPU process to launch the next step.
Kernel fusion combines what would typically be multiple separate kernels into a single, optimized kernel. This improves efficiency by reusing data already in registers, eliminating redundant load/store operations, reducing overall memory bandwidth pressure, and removing the latency associated with repeated CPU launches.
For example, a matrix multiplication followed by a bias addition is traditionally executed as two separate GPU kernels:
-
Kernel 1: Load matrices → multiply → store intermediate result to global memory -
Kernel 2: Load result from global memory + bias → add → store final output
With kernel fusion, this can be combined into a single operation:
Fused kernel: Load matrices and bias → multiply → add → store final output
This fused approach reduces memory traffic, requiring loading and storing matrices from global memory just once, eliminating the need for the intermediate stores and loads. For large matrices commonly used in AI workloads, this reduction in memory bandwidth usage can significantly boost performance and reduce cost.
zymtrace identifies these fusion opportunities in your specific workloads, helping customers achieve up to 30% performance improvements without changing their underlying models or algorithms. In a specific use case, we identified a bottleneck and recommended leveraging torch.compile (hat tip to torch.compile: The Missing Manual) to JIT compile and fuse GPU operations. The result? A staggering 300% speed-up with zero model changes.
It’s a perfect example of how zymtrace helps teams do more with fewer GPUs.
2. What’s the optimal batch size for my inference workloads?
Finding the “Most Efficient Point” (zP) for inference batch size is notoriously difficult and often requires trial and error. Too small, and you’re memory-bound, leaving expensive GPUs underutilized. Too large, and latency spikes with diminishing returns.
zymtrace profiles CUDA execution down to the instruction level, revealing exactly where your model shifts from memory-bound to compute-bound. This precision enables you to: Maximize throughput on your specific hardware configuration. Cut inference costs by operating at peak efficiency. Eliminate guesswork with profile-driven batch size selection. Visualize performance curves across different workloads.
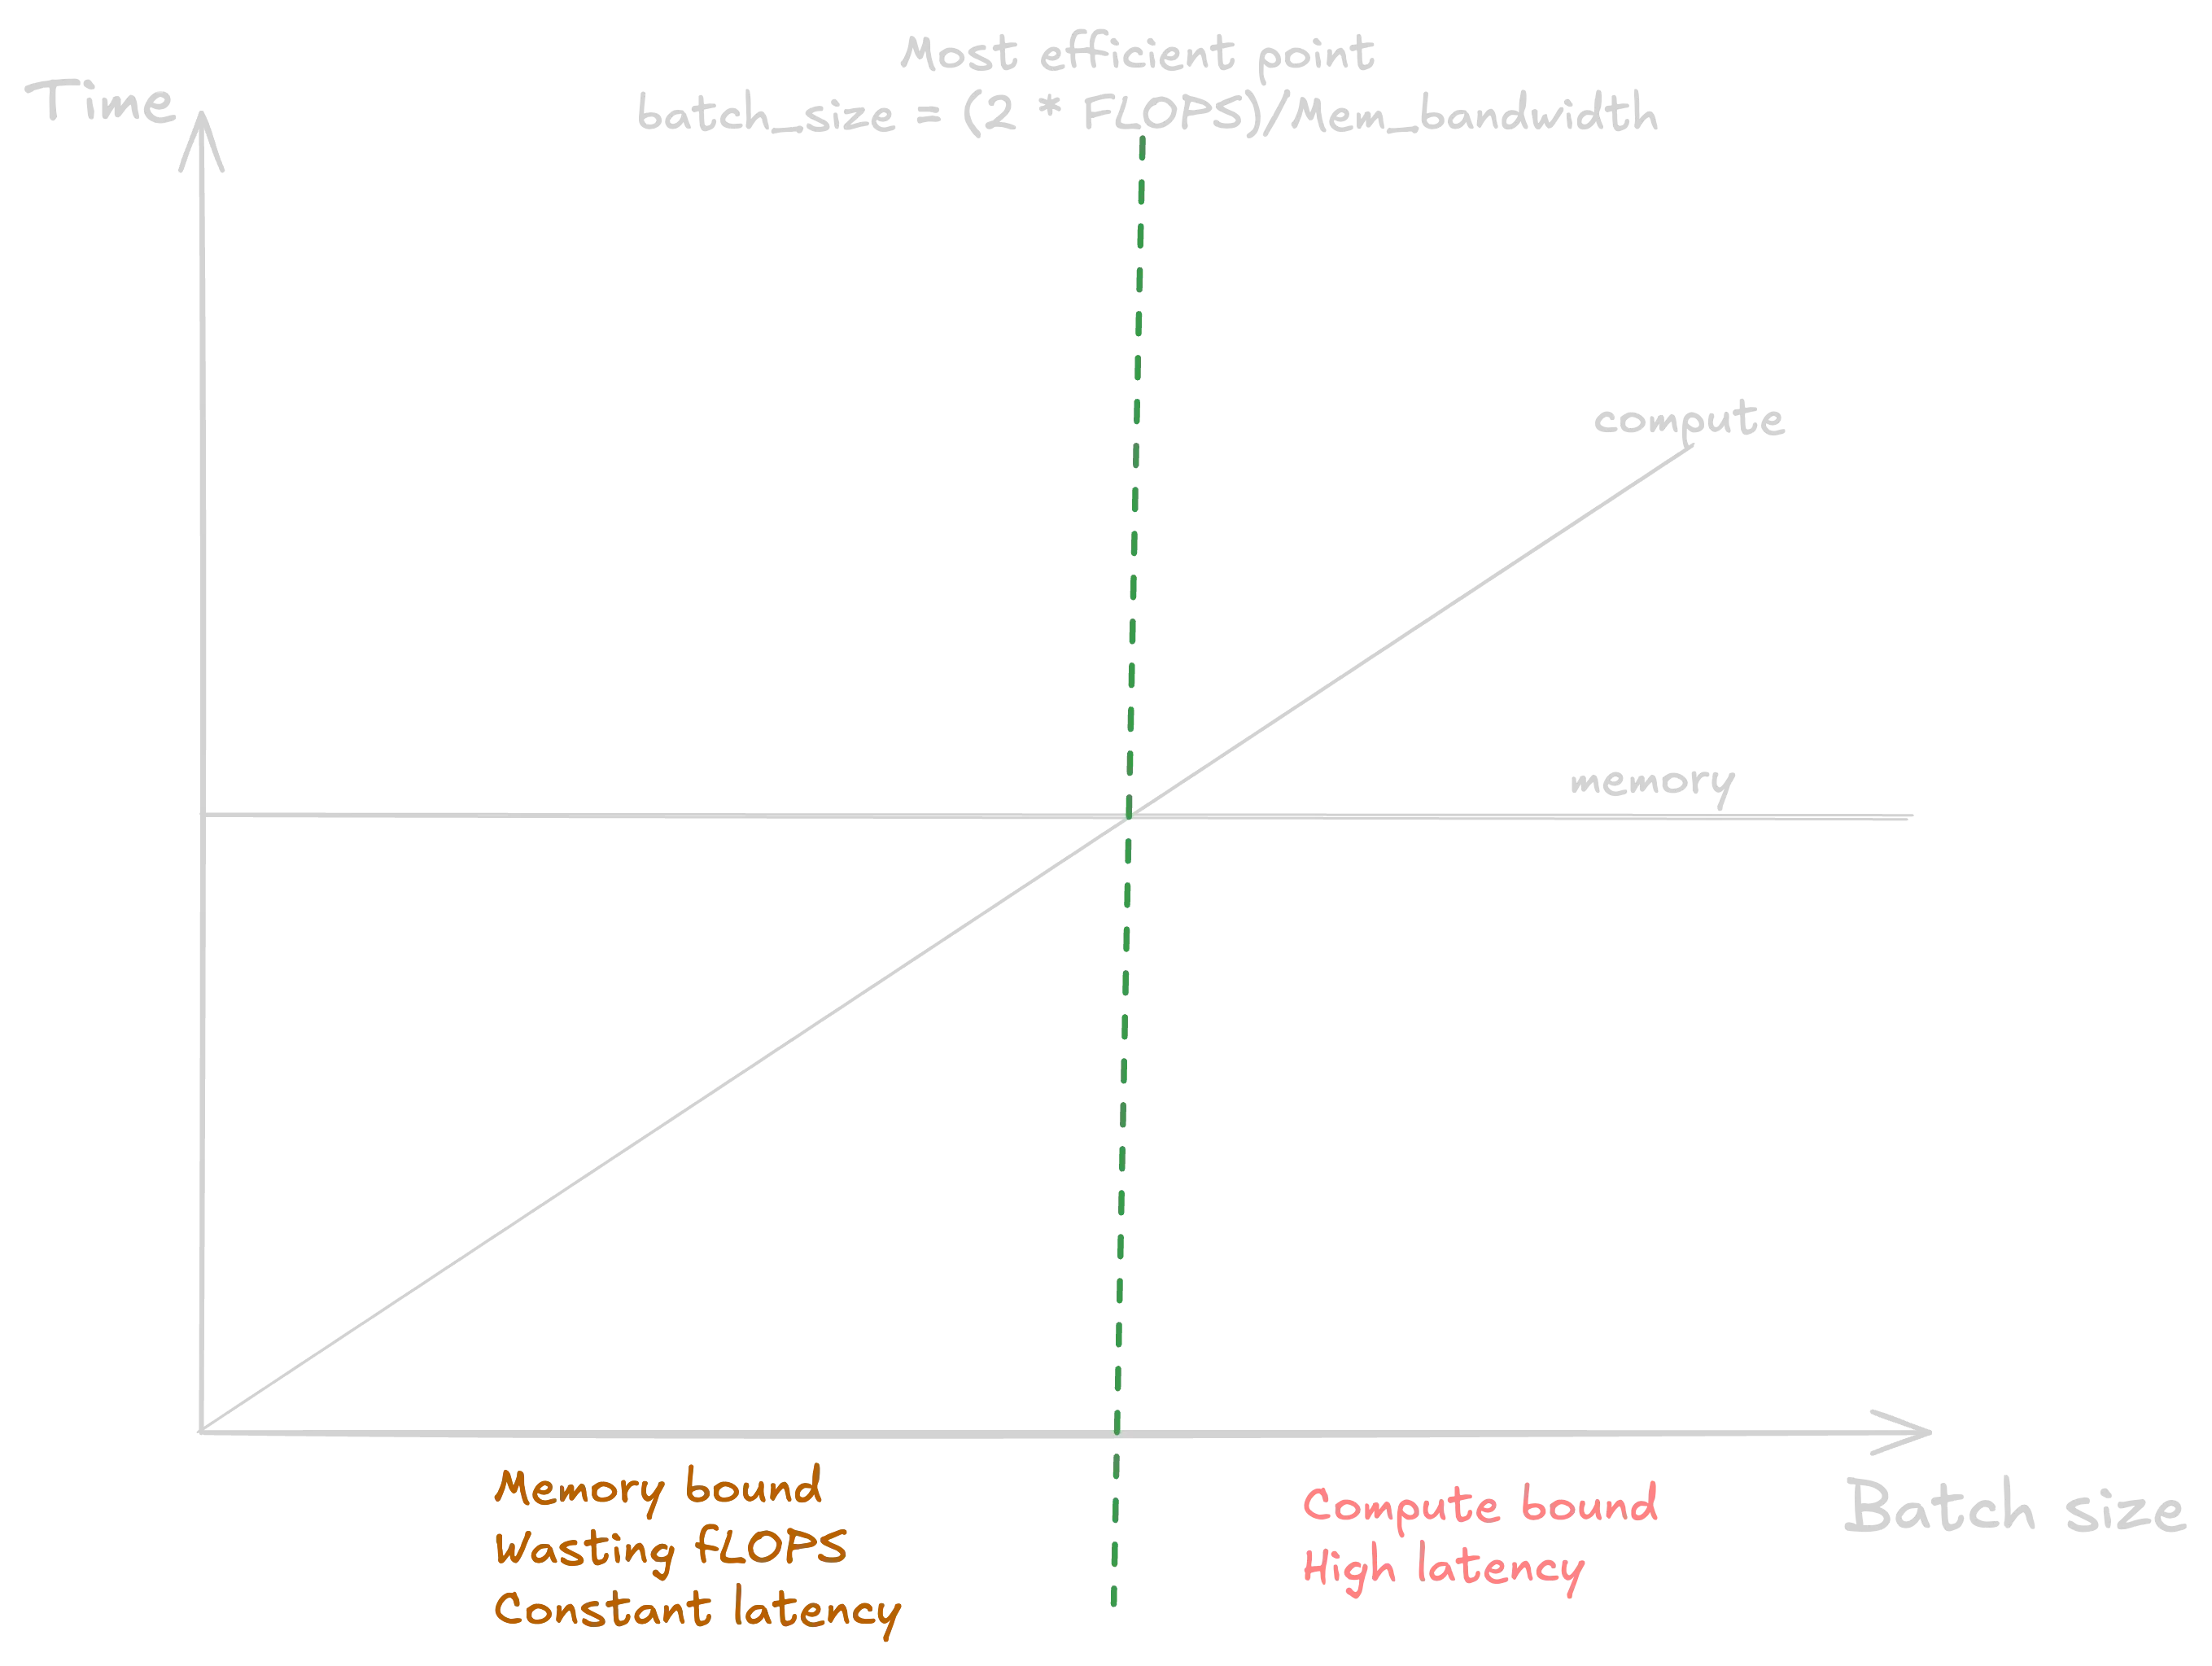
zymtrace helps you find the most efficient batch size
When you factor in kv caches and model size, zP can vary significantly across GPU types—whether you’re on H100s, A100s, or others.
3. Why aren’t my GPUs being utilized efficiently?
Perhaps the most elusive performance issue in heterogeneous computing is understanding the relationship between CPU and GPU operations. zymtrace bridges this gap by:
- Detecting stall reasons when GPUs sit idle
- Identifying CPU bottlenecks that impact GPU utilization
- Providing end-to-end visibility across the entire compute pipeline
This correlation is critical for teams trying to understand where time is being spent—and how to unblock pipeline stalls.
How it works
So, how does this work? Our profiler consists of two components:
- zymtrace-profiler, the agent that manages our BPF unwinders and implements profiling
- libzymtracecudaprofiler.so, a library that is loaded into your CUDA workload via CUDA’s CUDA_INJECTION64_PATH environment variable
The zymtrace CUDA profiler collects information about kernel launches and completions. The profiler also sample high-granularity information about precisely which GPU instructions (SASS) are running on the GPU’s compute cores and the reasons for what is currently preventing the kernel from making progress (stall reasons). These stall reasons provide clear indications on why the kernel is slow. For example, there are stall reasons indicating that the GPU is waiting for a slow read from global memory or when it is waiting for an oversubscribed math pipeline. This information is pre-aggregated within the CUDA profiler and then sent out to zymtrace-profiler.
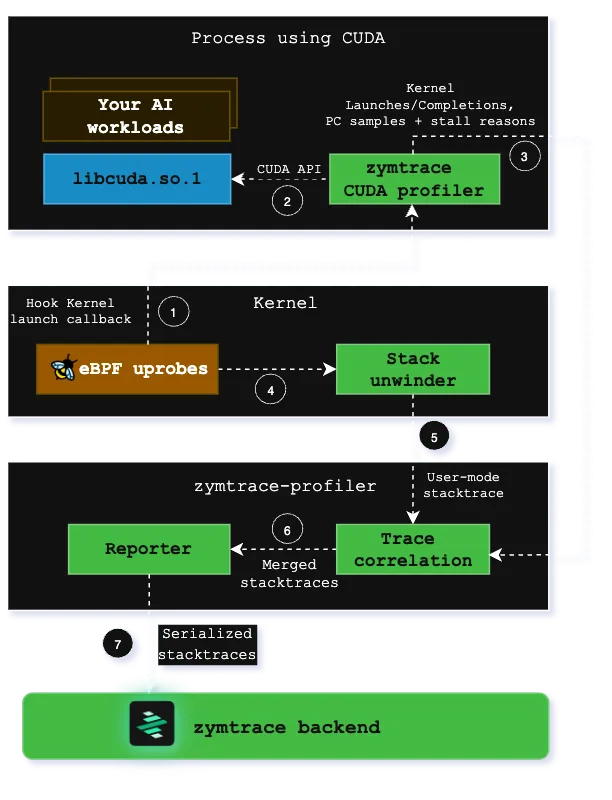
How the profiler works
Within libzymtracecudaprofiler.so, we place callbacks on all CUDA functions that can launch a kernel. zymtrace-profiler detects the CUDA profiler and places a uprobe on an exported function that is called each time that a kernel is launched. The uprobe, in turn, invokes the CPU stack unwinder that we’re also using for CPU profiling in general. The BPF code additionally collects a variety of information about the kernel launch that is sent along with the stack trace to enable correlation with the data that is collected in the CUDA profiler library.
Once both the stack traces collected in BPF and the kernel launch/completion data arrives in zymtrace-profiler, they are merged together and sent out as a single combined stack trace that spans from the user-mode code that enqueued the kernel into the CUDA kernel that got invoked on the GPU and, if enabled, the individual instructions and stall reasons.
These traces are then sent out to our backend, ready to be visualized as a flamegraph within our UI.
Looking Ahead
We’re leveling up our support for JAX and other frameworks that lean heavily on CUDA Graph.
Secondly, we’re making it easy to identify and optimize inefficient code—no flamegraph expertise required. We’ve already done the heavy lifting by collecting detailed GPU and CPU profiling data across your entire fleet. Now, we’re building the next layer: curated insights and actionable recommendations that cut through the noise. While flamegraphs are powerful, they’re not always intuitive—so instead of expecting you to decode them, we’ll surface what matters most, when it matters, so you can move fast and optimize with confidence.
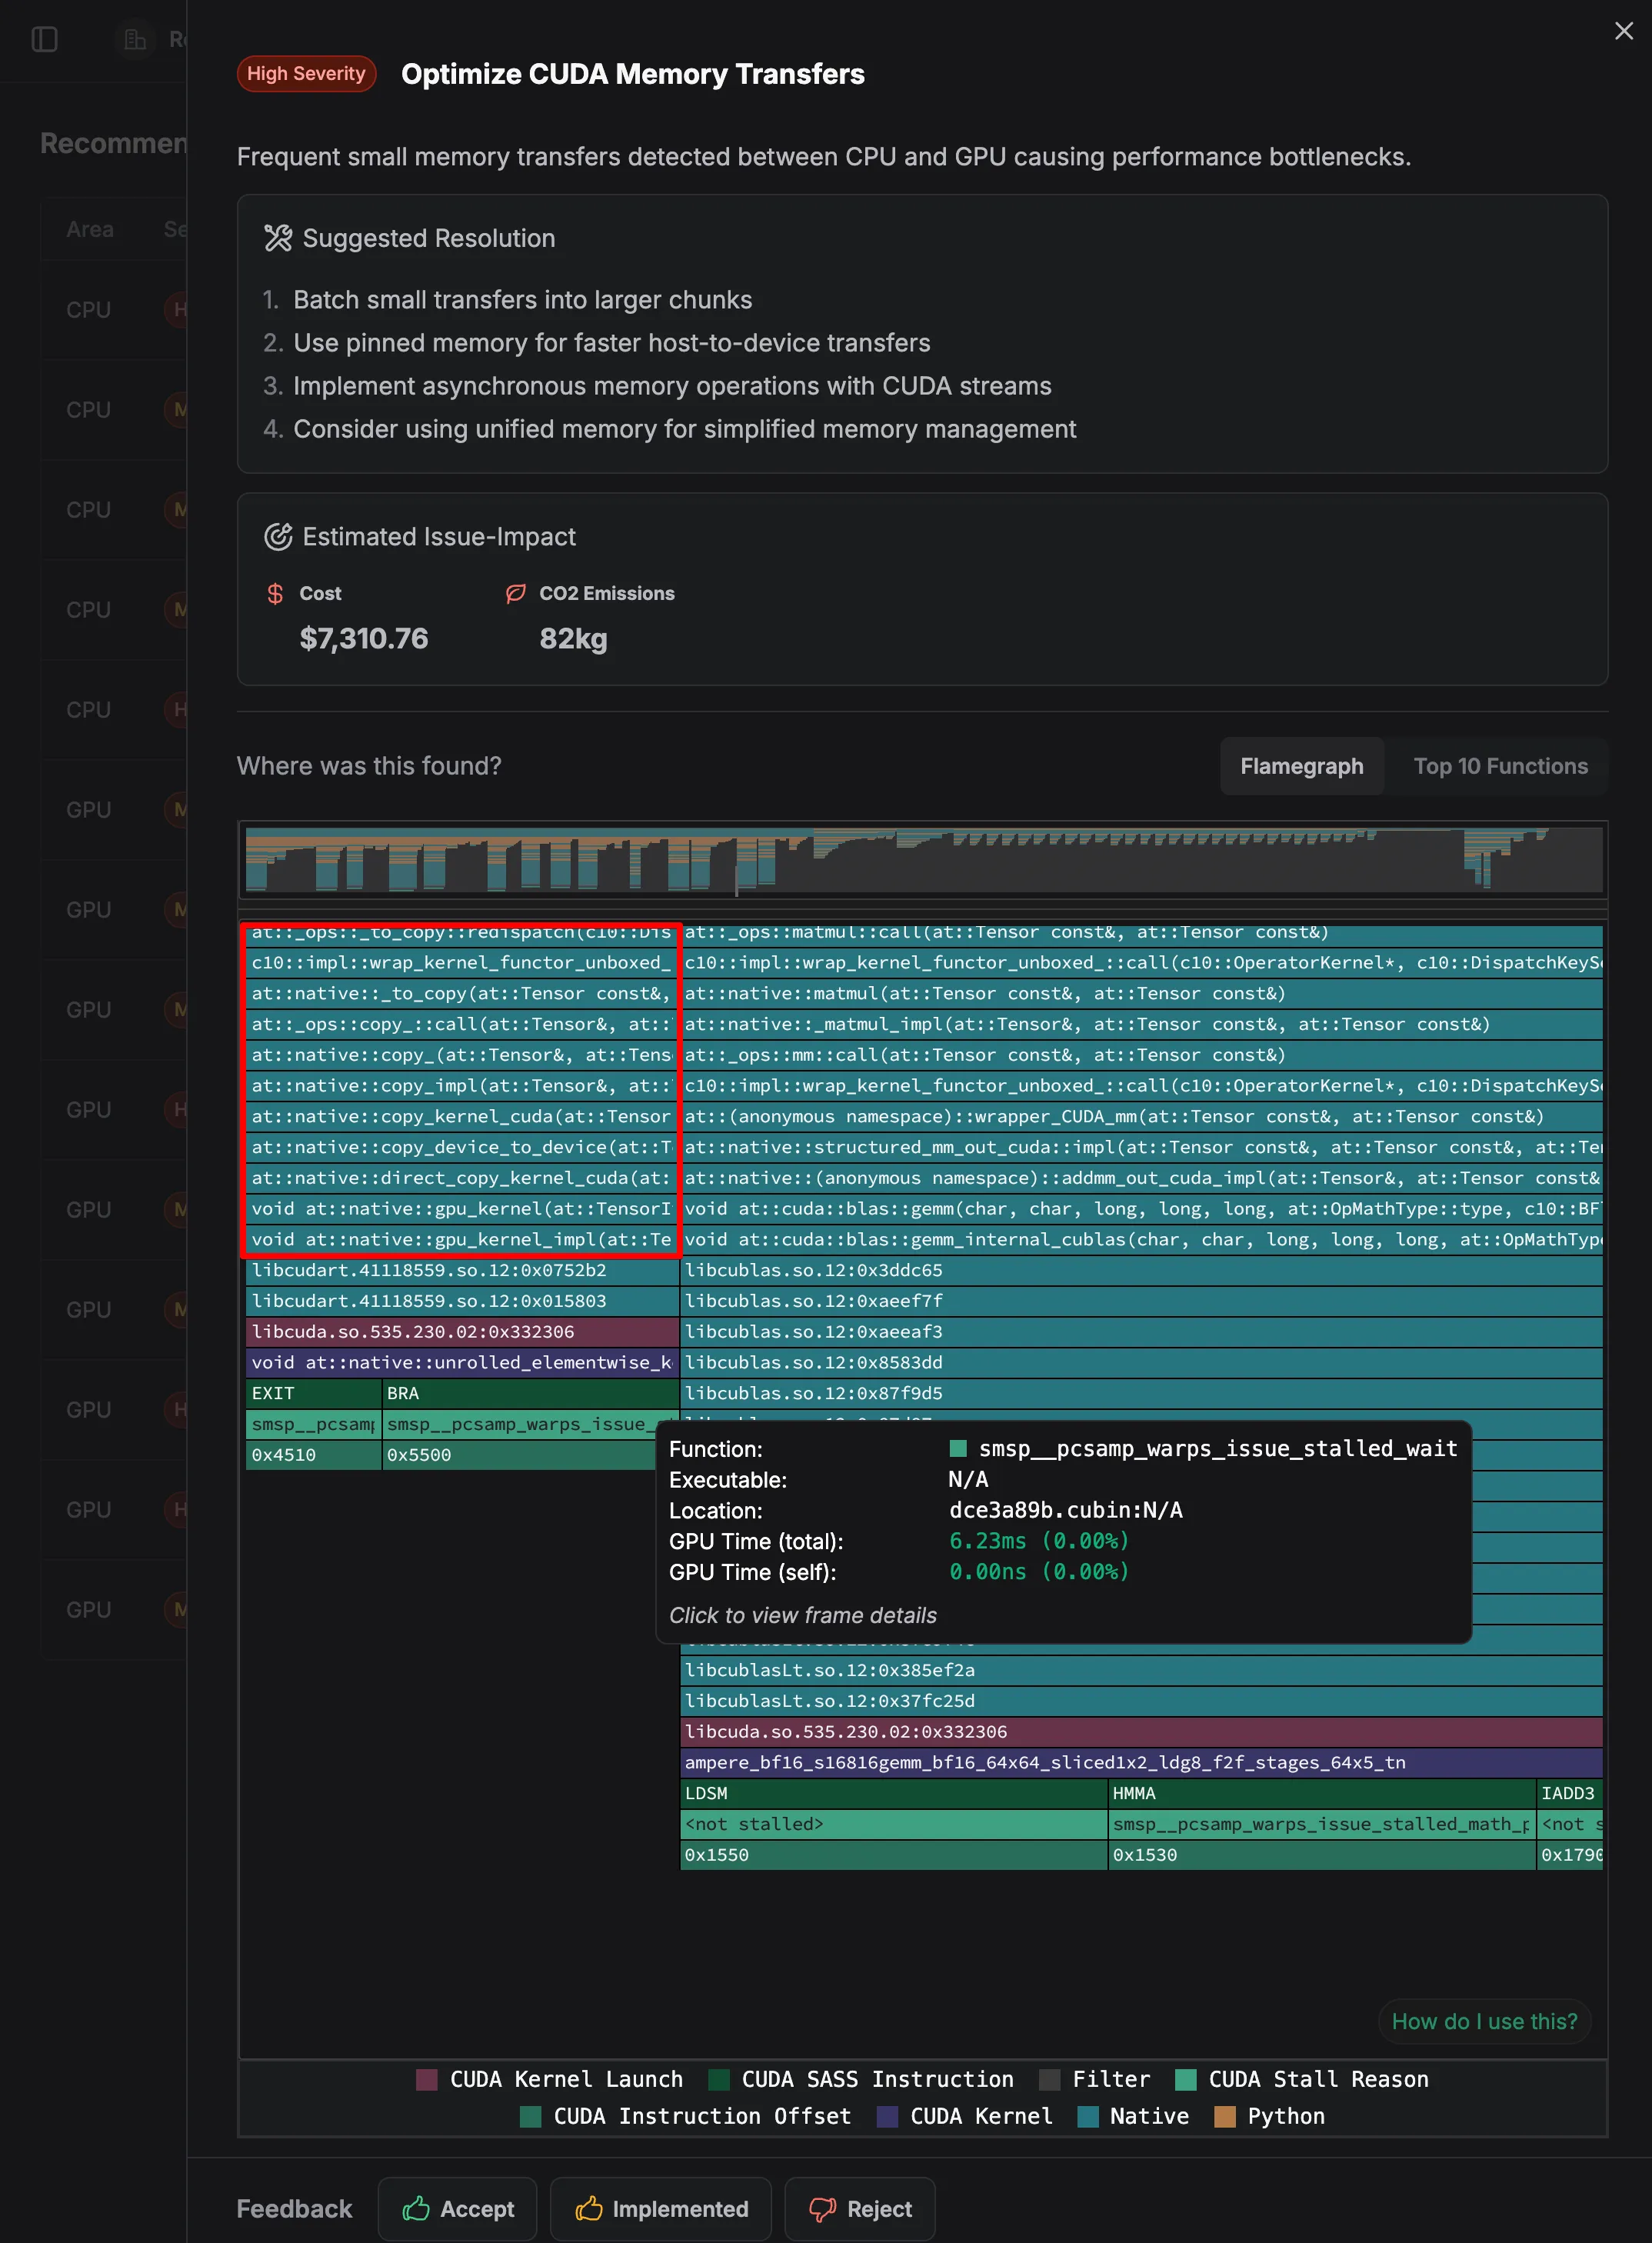
In the above example, the zymtrace gpu profiler detected that your application is making many small memory transfers between CPU and GPU instead of fewer, larger transfers. It presents the cost and carbon impact of this operation and ultimately suggests how to fix it.
The issue creates significant overhead and slows down your application, as each transfer has initialization costs that can’t be amortized over small data sizes.
Evidence of this inefficient pattern can be seen in the numerous small operations visible in the flamegraph, particularly in functions like:
at::native::io_copyat::ops::copy_at::native::copy_implat::native::copy_kernel_cudaat::native::copy_device_to_deviceat::native::direct_copy_kernel_cuda
The flamegraph shows these copy operations appearing frequently and in small fragments, indicating your application is constantly moving small chunks of data back and forth between CPU and GPU memory, rather than processing data in larger batches.
Each of these small transfers incurs launch overhead, driver synchronization costs, and bus transfer latency that becomes proportionally smaller with larger transfers.
Try It Yourself
zymtrace runs fully on-premises. It works perfectly in air-gapped environments. All you need is 5 minutes to stand it up. 👉Get started here
The NVIDIA logo is a trademark and/or registered trademark of NVIDIA Corporation in the U.S. and other countries.
