
Israel Ogbole
9 mins read
•
📉 The structural inefficiencies leaving up to 60% of GPU capacity idle, costing $4.6M–$6.9M per month in a 1,000-GPU cluster, and how zymtrace turns that waste into optimized throughput via profile-guided AI optimization
Modern AI infrastructure has evolved faster than the operational models around it. As a result, many GPU clusters carry hidden economic inefficiencies that are architectural in nature, not the result of misconfiguration or operational decisions, but a consequence of tooling that hasn’t kept pace with cluster-wide, distributed heterogeneous compute.
In our previous case study, Anam used zymtrace to diagnose a hidden bottleneck in their GPU inference pipeline and unlocked a 2.5x latency reduction and 90% higher throughput on the same hardware, with no model changes. The culprit was Python GIL contention that was starving the GPUs. With the root cause captured in zymtrace, Anam routed the context to an AI agent via the zymtrace MCP server, which produced pull requests in minutes.
Anam is the public example we can write about. Across larger enterprise deployments, we have observed throughput improvements of up to 7.5x, across workloads where deep NCCL synchronization lags, memory fragmentation, and multi-node contention were compounding invisibly. Those customers cannot be named, but the pattern is consistent: the gains are large, the fixes are targeted, and the bottlenecks were undetectable with standard tooling.
The question worth answering is what these gains are actually worth: not just in hardware savings, but in unit economics, real cash. For any inference business, the metrics that matter are cost per token, cost per generated frame, requests served per GPU. Every idle GPU cycle between kernel launches is a direct tax on those numbers: more hardware required to serve the same volume, thinner margins, slower responses. GPU efficiency and inference unit economics are the same metric, expressed differently.
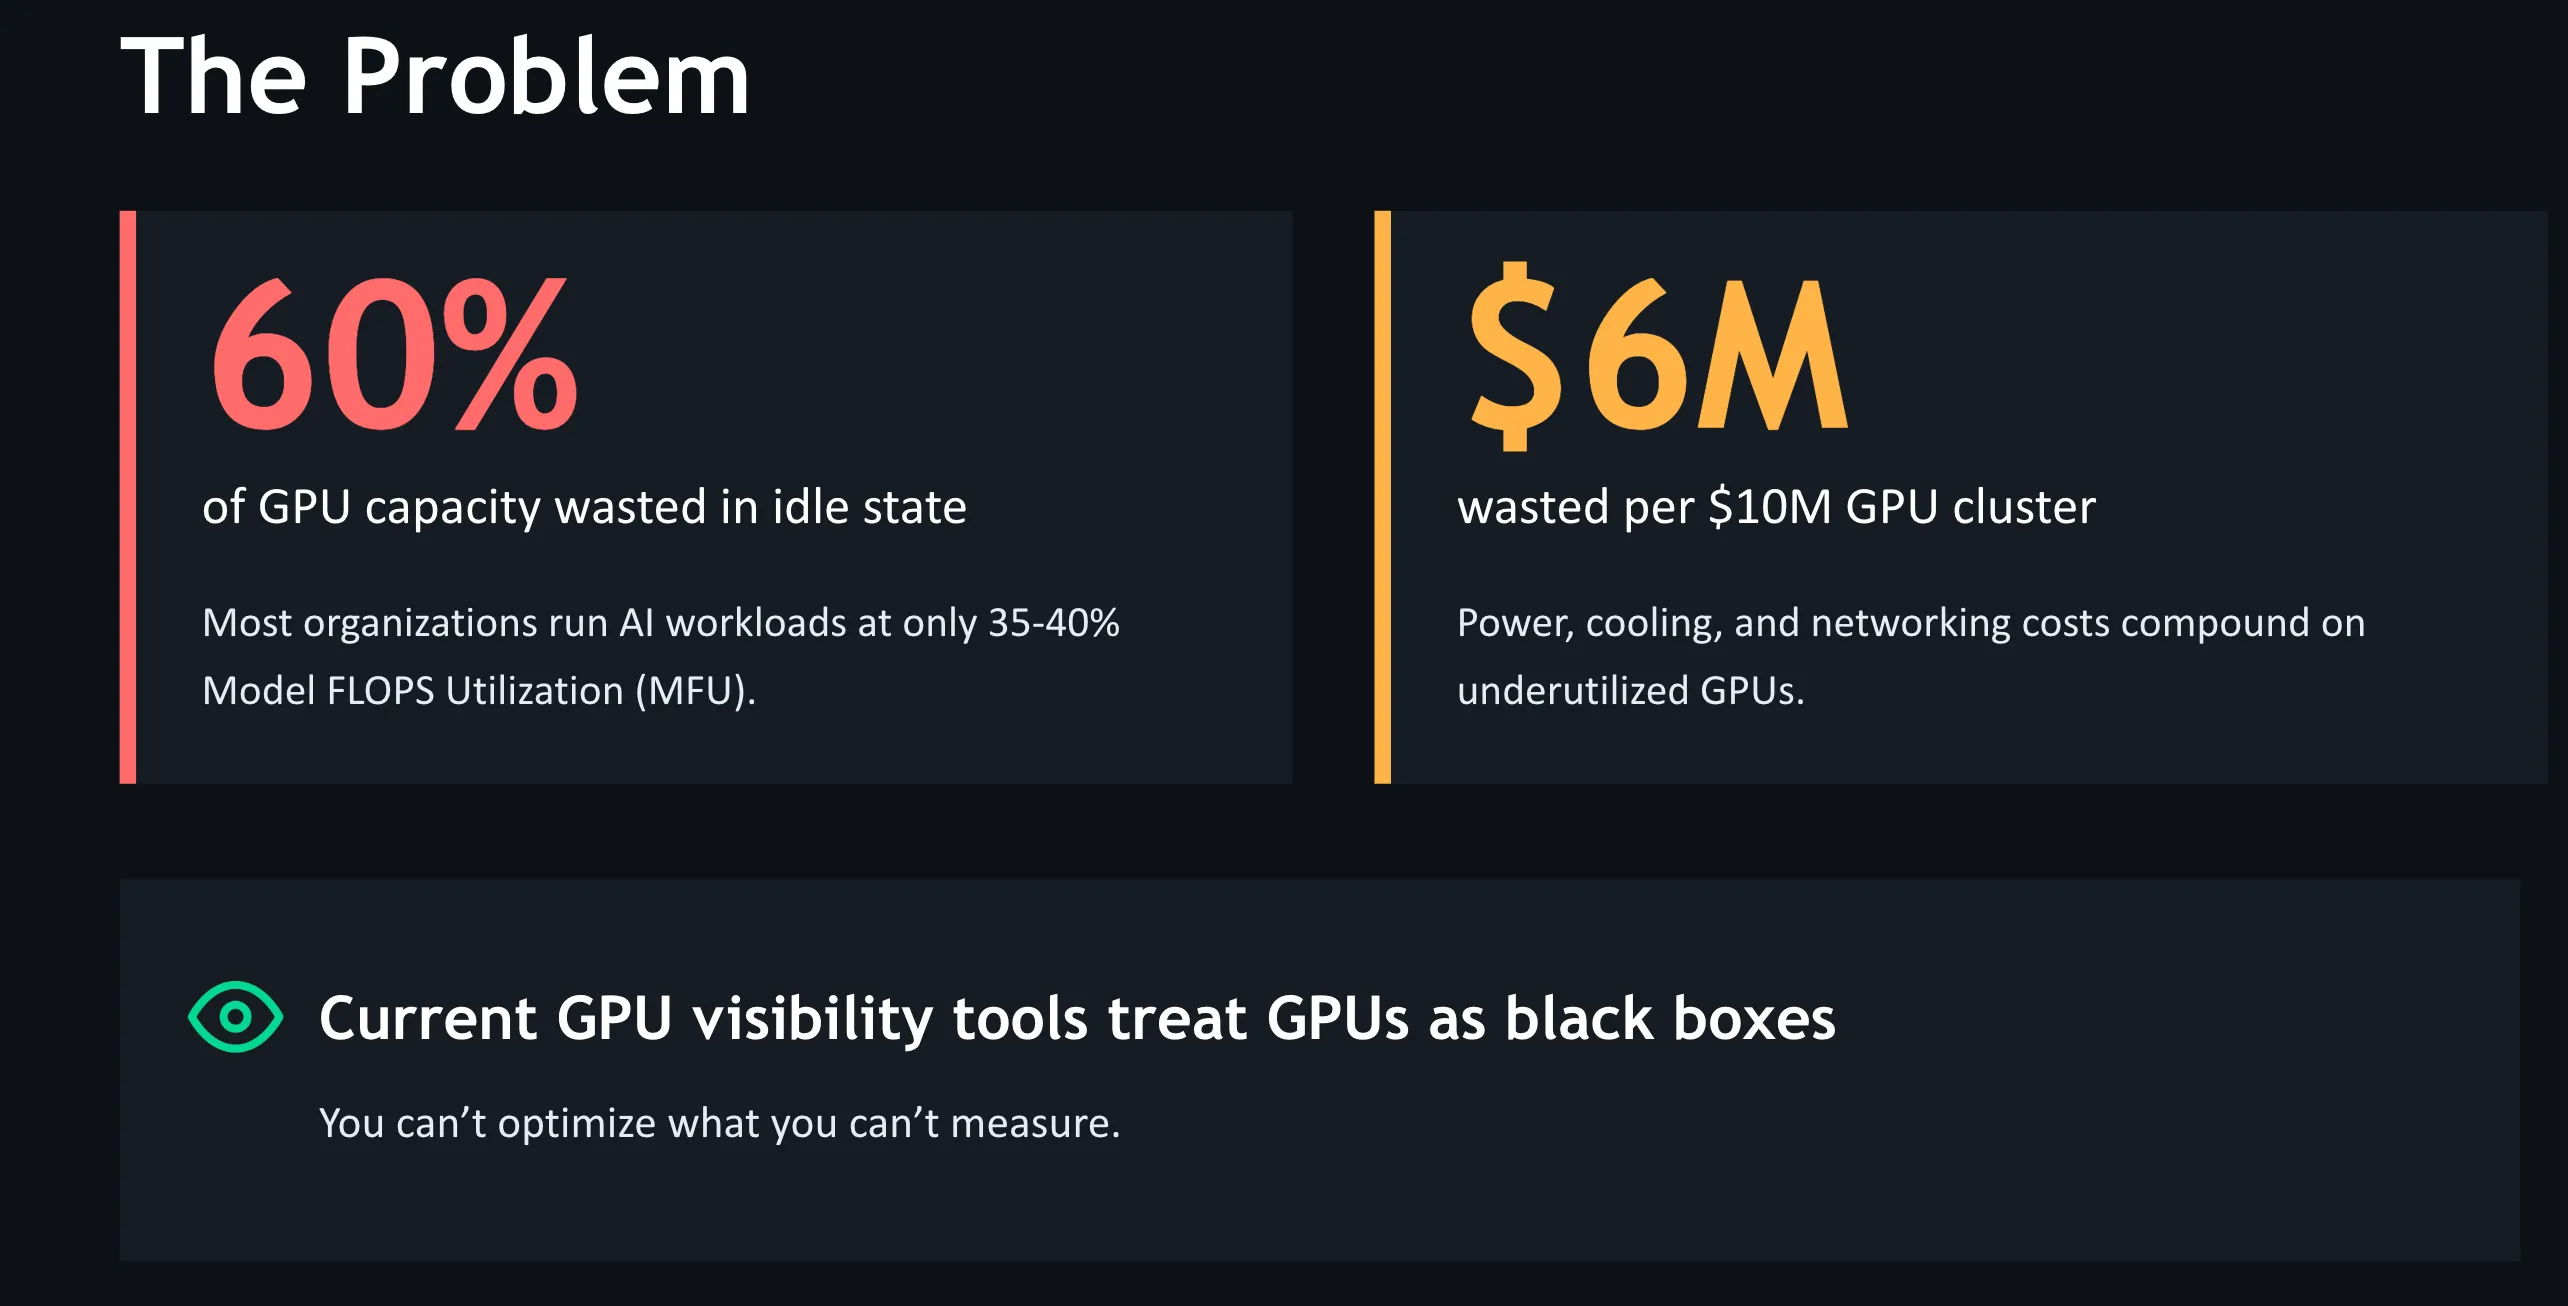
60% of GPU capacity sits idle at most organizations

The Numbers
CoreWeave lists the NVIDIA GB200 NVL72 at $42.00/instance/hour, where each instance contains 4 GPUs, or $10.50/GPU/hour on-demand.1 A 1,000-GPU cluster at that rate costs $7.7M per month, or $92M per year in compute spend. Most clusters of this size operate at 25–40% utilization.2
Applying Anam’s gains to a cluster of this scale:
90% throughput improvement.
1,000 GPUs now deliver the output of a 1,900-GPU fleet. An organization scaling to meet that demand the conventional way would provision 900 additional GPUs. With a 90% throughput gain, that expansion becomes unnecessary.
- Monthly saving:
$6.9M - Annual saving:
$82.7M - Unit economics:
90%more requests served per GPU, at the same infrastructure cost per token
2.5x inference latency reduction.
The same request volume can be served by 400 GPUs instead of 1,000, and the remaining 600 are released without degrading SLA.
- Monthly saving:
$4.6M - Annual saving:
$55.2M - Unit economics: cost per inference request drops by
60%on the same hardware
Applied together, these gains represent a potential $11.5M/month ($137.9M/year) reduction in GPU infrastructure spend on a 1,000-GPU cluster, without provisioning a single additional GPU.
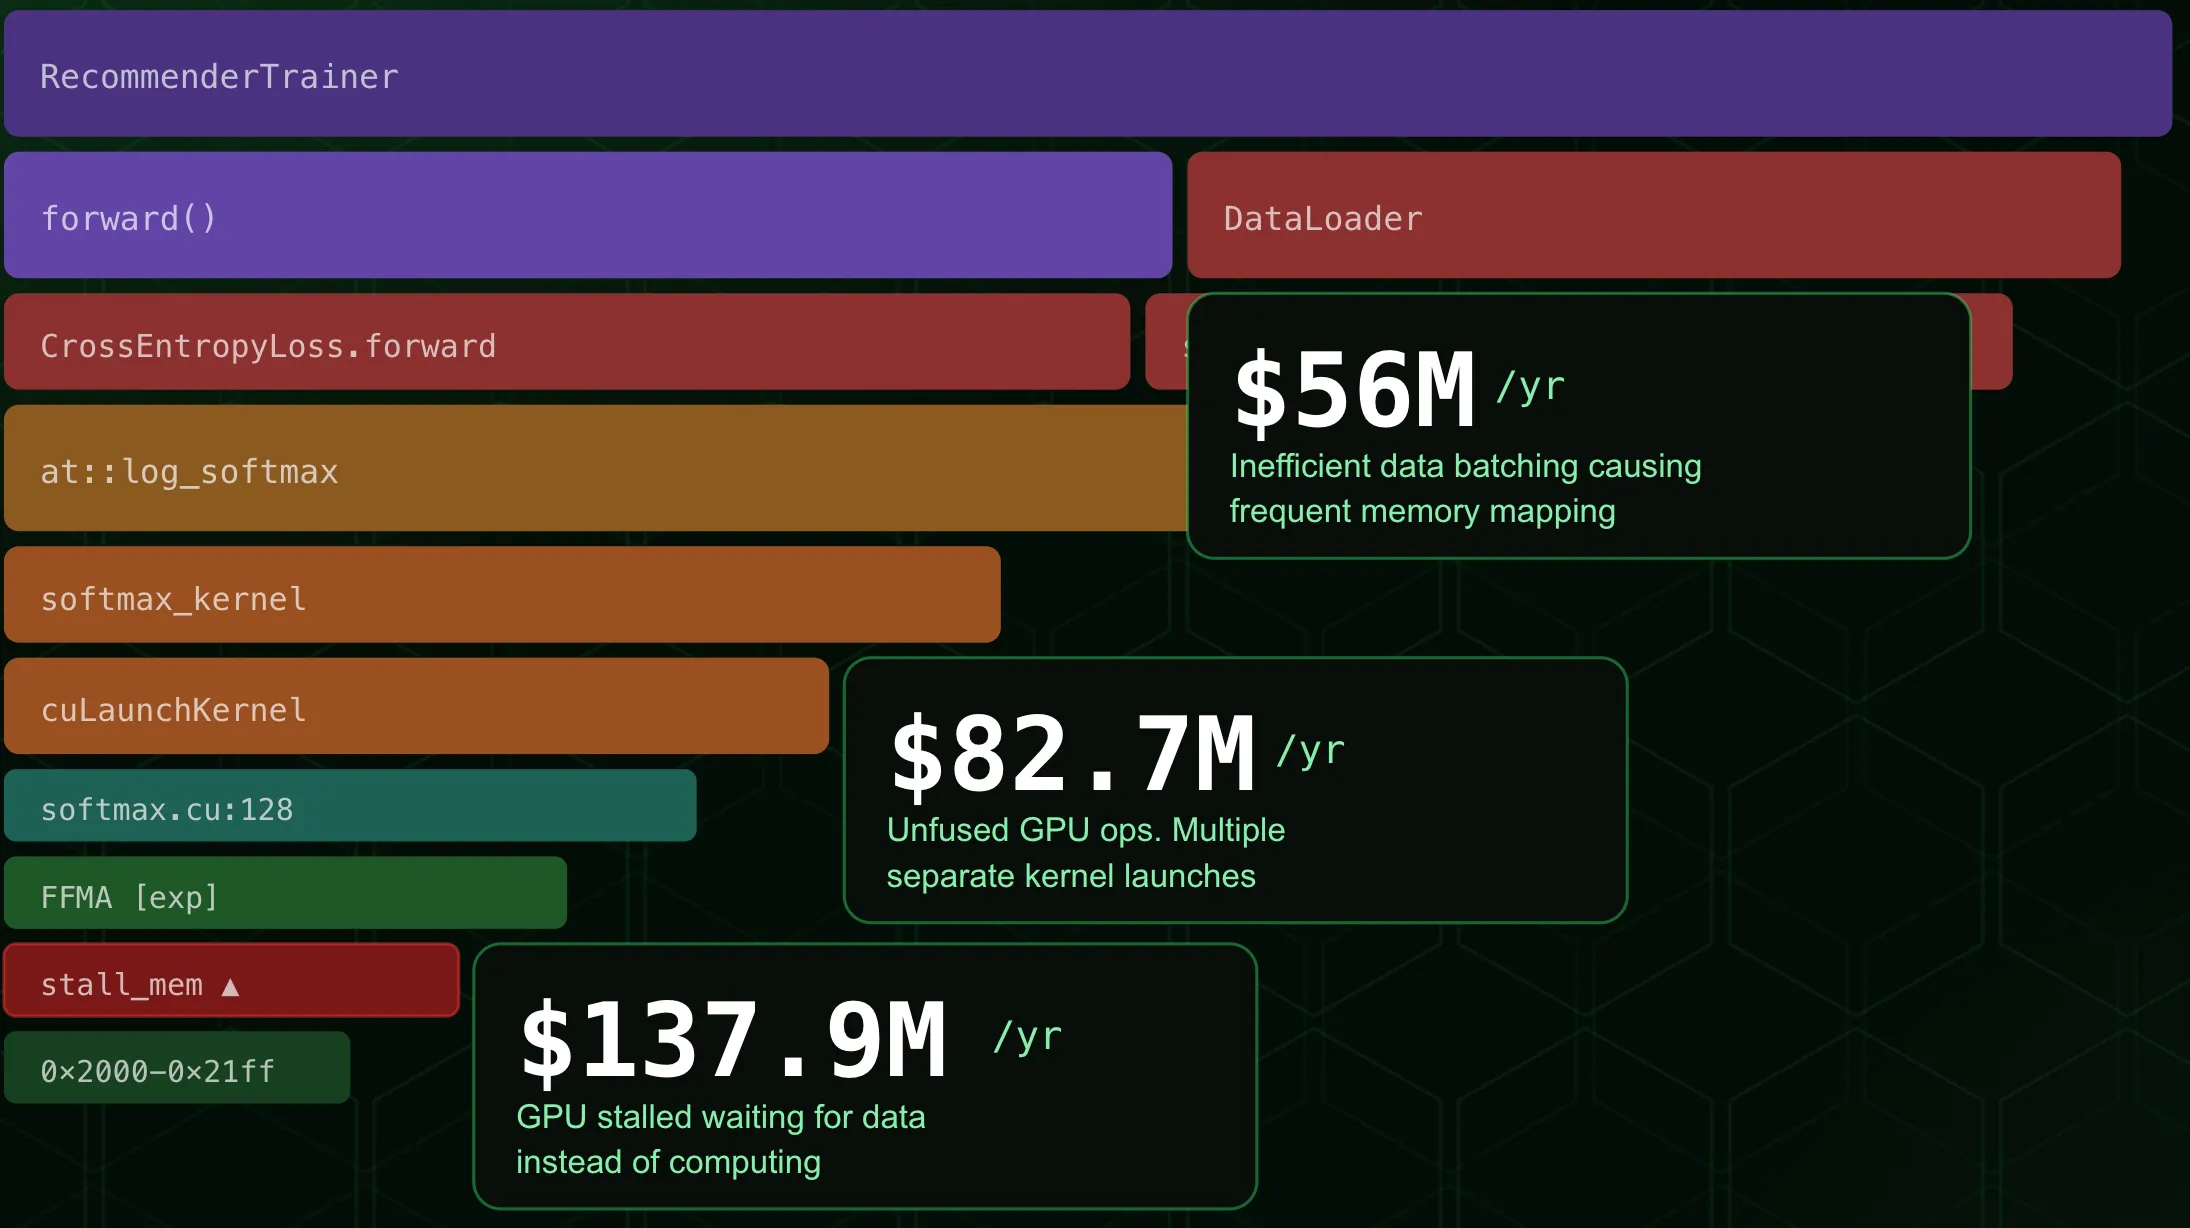
zymtrace surfaces specific cost drivers in the execution stack

At 7.5x throughput — the upper end of what we observe in larger enterprise clusters — the same 1,000 GB200 GPUs replace a 7,500-GPU fleet. Cost per token drops by an order of magnitude. At that point the unit economics of the entire AI operation change, and so does the competitive position of the business built on top of it.
The constraint in all of these cases is the same: you cannot optimize what you cannot see.
What Production Visibility Actually Requires
Profiling in development validates kernels and architecture in controlled conditions. Production profiling reveals how the entire system behaves under real load: sustained throughput, real input distributions, memory pressure, and interactions between components that don’t exist in a lab environment. The tooling requirements are different.
Effective production observability needs four things:
- Always-on data collection: the evidence must exist when a regression occurs, not require manual capture after the fact
- Zero instrumentation: profiling must not require code changes, recompilation, or debug symbols
- Full-stack correlation: engineers must be able to follow the execution path from a Python function through native code, CUDA kernel launches, and GPU instruction execution, with deeper insight into NCCL, NVTX, memory, and compute performance across the heterogeneous stack.
- Fleet-wide scope: bottlenecks that originate in one node but manifest across the cluster must be visible as a single coherent picture
Why PyTorch Profiler and Nsight Won’t Surface These Gains
When GPU performance degrades in production, most engineers reach for PyTorch Profiler or NVIDIA Nsight. Both are well-built tools designed for development environments. In production, each hits a structural wall.
PyTorch Profiler operates within the Python execution graph. Modern inference frameworks like SGLang move logic into Rust or C++. When execution crosses that boundary, the profiler loses context entirely.
NVIDIA Nsight Systems captures windows of five minutes or less. Production regressions are frequently intermittent, emerging under specific input distributions or after hours of sustained load. A five-minute snapshot rarely contains the event that caused it.
NVIDIA Nsight Compute goes deeper, but serializes GPU execution to collect metrics. The overhead can slow workloads by orders of magnitude, often masking the race conditions and launch jitter that triggered the investigation.
All three operate per-process and per-node, on-demand. The Anam regression (a denoising loop re-entering the Python interpreter on every step, throttling CPU dispatch and leaving the GPU idle between kernel launches) was cross-layer, intermittent, and load-dependent. It wouldn’t have appeared in a five-minute Nsight window. PyTorch Profiler couldn’t see across the language boundary. DCGM metrics in Grafana showed low utilization with no path to the cause. The data existed in zymtrace’s continuous, always-on profiling. An AI agent queried it using Profile Guided AI Optimization, and raised the fix as a pull request, in minutes. Anam now serves more requests per GPU, at lower cost per frame, with the same hardware.
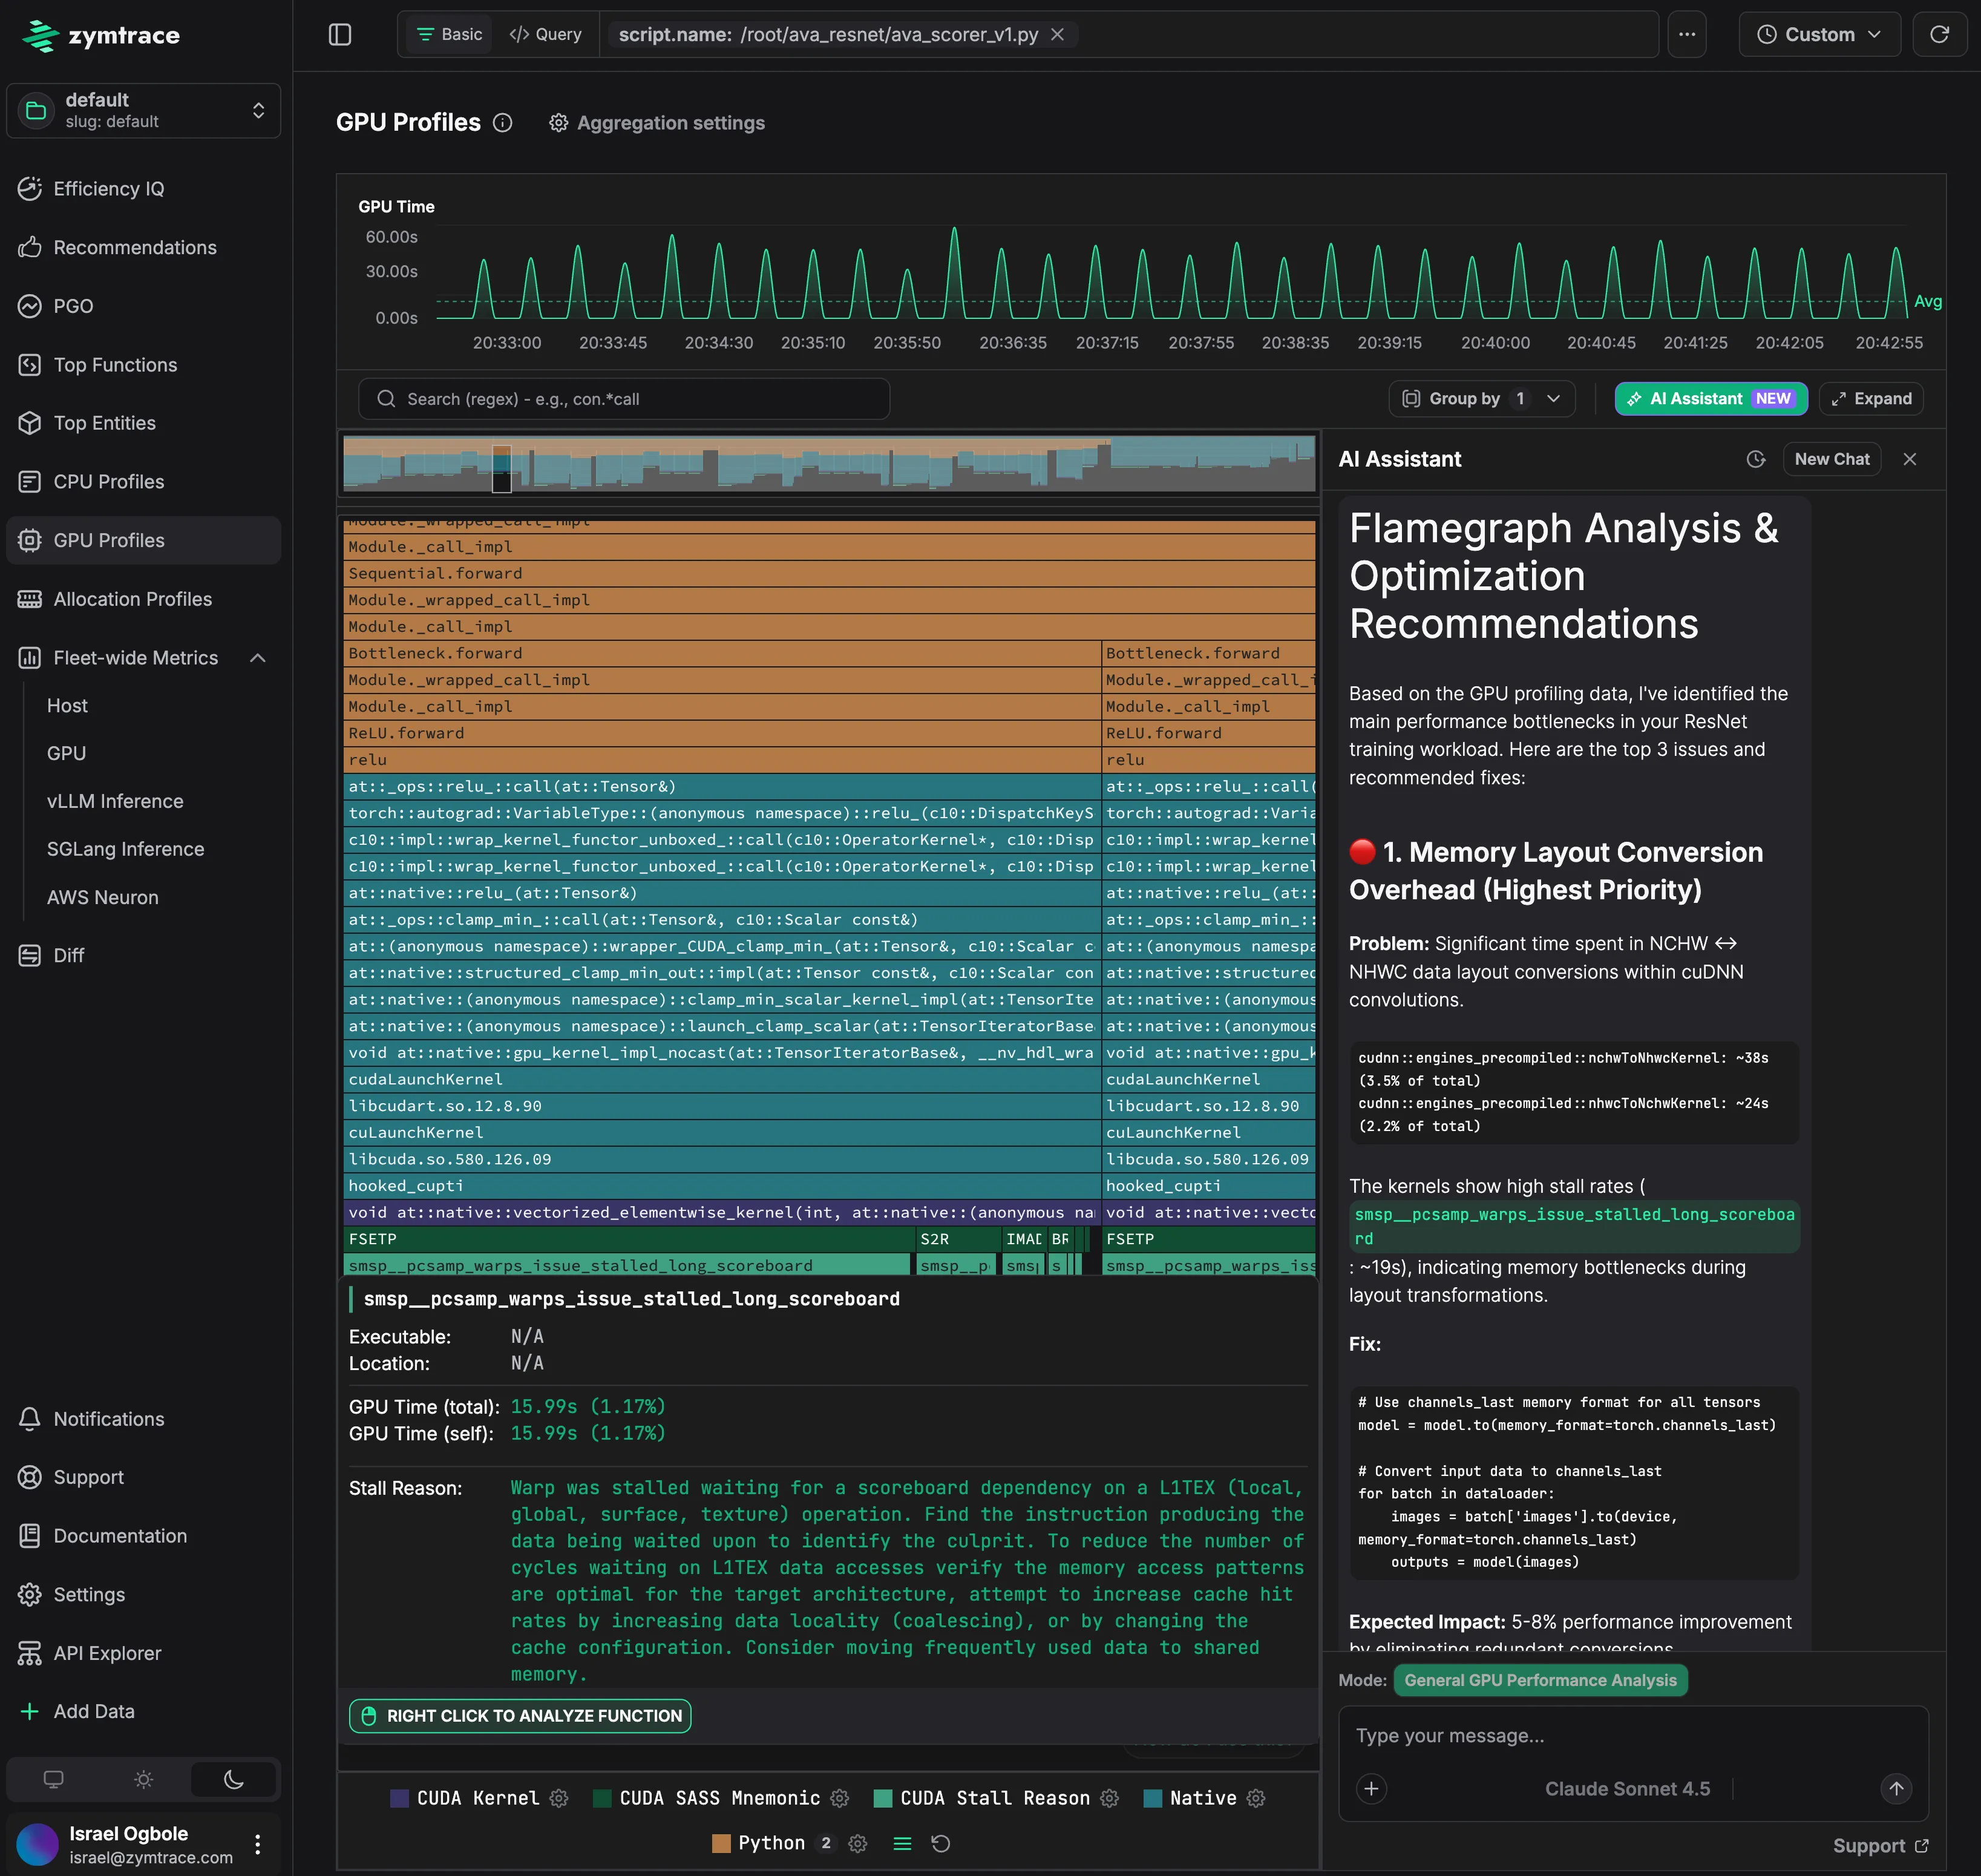
zymtrace GPU Profiles: continuous flamegraph data with AI-powered analysis and recommendations

The Cost of Staying Blind
Every month a performance bottleneck goes unresolved on a 1,000-GPU GB200 cluster, between $4.6M and $6.9M in capacity is being paid for and not used, a direct consequence of the 25–40% utilization rates the industry already accepts as normal.2
But the monthly spend is only part of it. The deeper cost is structural. Teams that cannot see their infrastructure clearly default to the same response every time performance degrades: provision more hardware. Each provisioning cycle embeds the inefficiency more deeply: more GPUs running at the same utilization rate, more spend, the same underlying problem. Over a two or three-year infrastructure cycle, that compounds into a cost base that is fundamentally higher than it needs to be.
There is also the competitive dimension. AI teams that can iterate faster, because their infrastructure is efficient, observable, and self-correcting through agentic workflows, compound their advantage over time. The gap between a team running at 40% utilization and one running at 80% is not just a cost difference. It is a difference in how many experiments they can run, how quickly they can move from training to deployment, and how much of their budget is available for model development versus infrastructure remediation.
The Anam result (2.5x latency reduction, 90% throughput increase, applied automatically via agentic engineering) is a signal of what that gap looks like when it closes.
zymtrace’s Profile Guided AI Optimization starts with continuous, fleet-wide visibility. zymtrace is built to provide that, turning profiling data into agentic action, with minimal performance overhead, and without requiring a specialist to be in the loop every time something degrades.
Read the full Anam case study: How Anam Achieved 250% Faster Inference Using zymtrace Continuous GPU Profiling
Footnotes
-
CoreWeave GB200 NVL72 on-demand pricing: $42.00/instance/hour (4 GPUs per instance = $10.50/GPU/hour). CoreWeave also offers reserved capacity discounts of up to 60%, which would reduce the effective rate further for long-term enterprise commitments. CoreWeave GPU Cloud Pricing ↩
-
Uptime Intelligence found that even well-optimized models reach only 35–45% of the compute performance the silicon can deliver, placing typical utilization in the 25–40% range, and note the numbers are likely worse for inference. GPU Utilization Is A Confusing Metric. Anyscale independently confirms that production AI workloads often achieve well below 50% sustained utilization, even under load. GPU (In)efficiency in AI Workloads. ↩ ↩2


