CPU profiling

Whole-system on-CPU and off-CPU profiling

See which code costs you the most CPU across your fleet, measured in the cores you pay for, and prove each fix with a before-and-after diff. No instrumentation, no restarts.
  • eBPF
  • x86_64 and Arm64
  • Kubernetes-aware
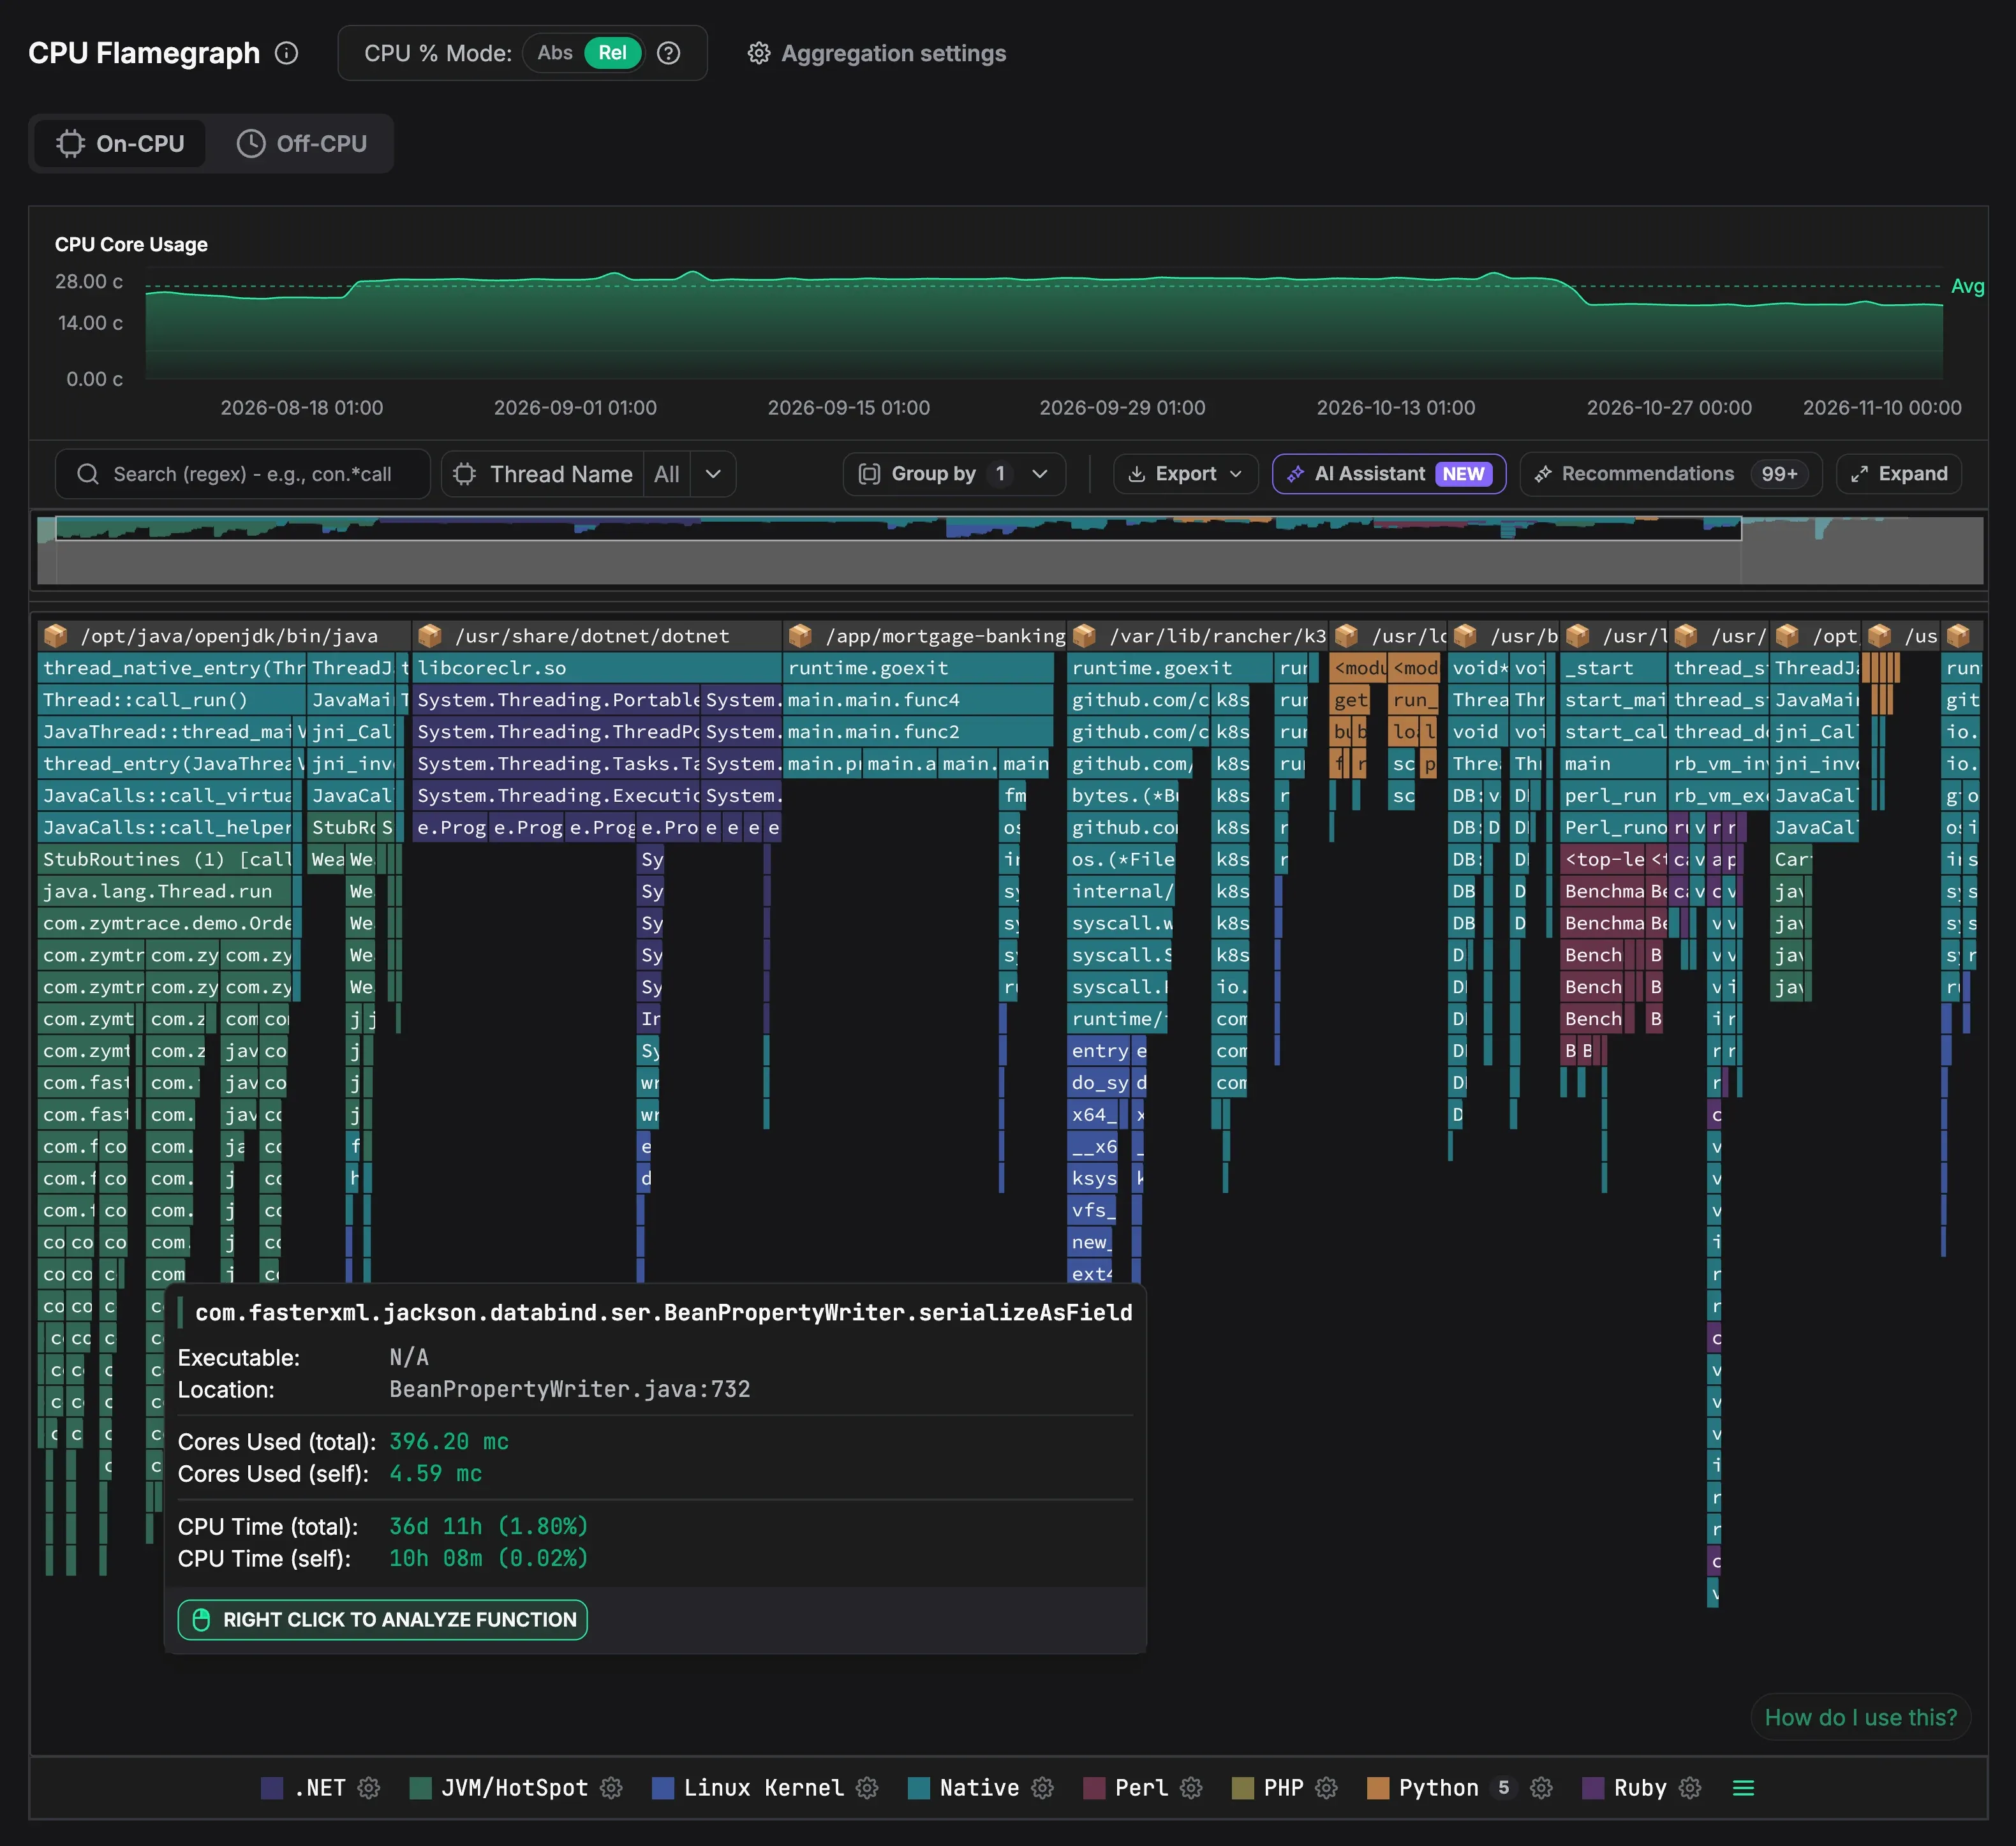
The CPU flamegraph in on-CPU mode, under three months of the fleet's CPU core usage. Java, .NET, Go, Perl, Python and Ruby processes sit side by side, each executable a root, with frames colored by language. The hover card for Jackson's BeanPropertyWriter.serializeAsField shows 396.20 millicores used and 36 days 11 hours of CPU time, 1.80% of the total.
C and C++
.NET
Go
Java
Node.js
Perl
Python
Ruby
Rust
Scala
V8
Zig
Right-sizing

Kubernetes right-sizing from real usage

K8s Resource IQ compares each container's requests and limits with what it used over the last 14 days, and adds up the CPU and memory you can reclaim.

  • CPU set at the 90th percentile plus 15%, memory at the daily peak plus 30%
  • Under-provisioned containers flagged, and no cuts for throttled ones
Blocked time

Off-CPU profiling

See where threads wait on locks, I/O and the scheduler.
  • Scheduler latency included, the time a thread waits for a free CPU
  • Turns on from the UI, with no restarts
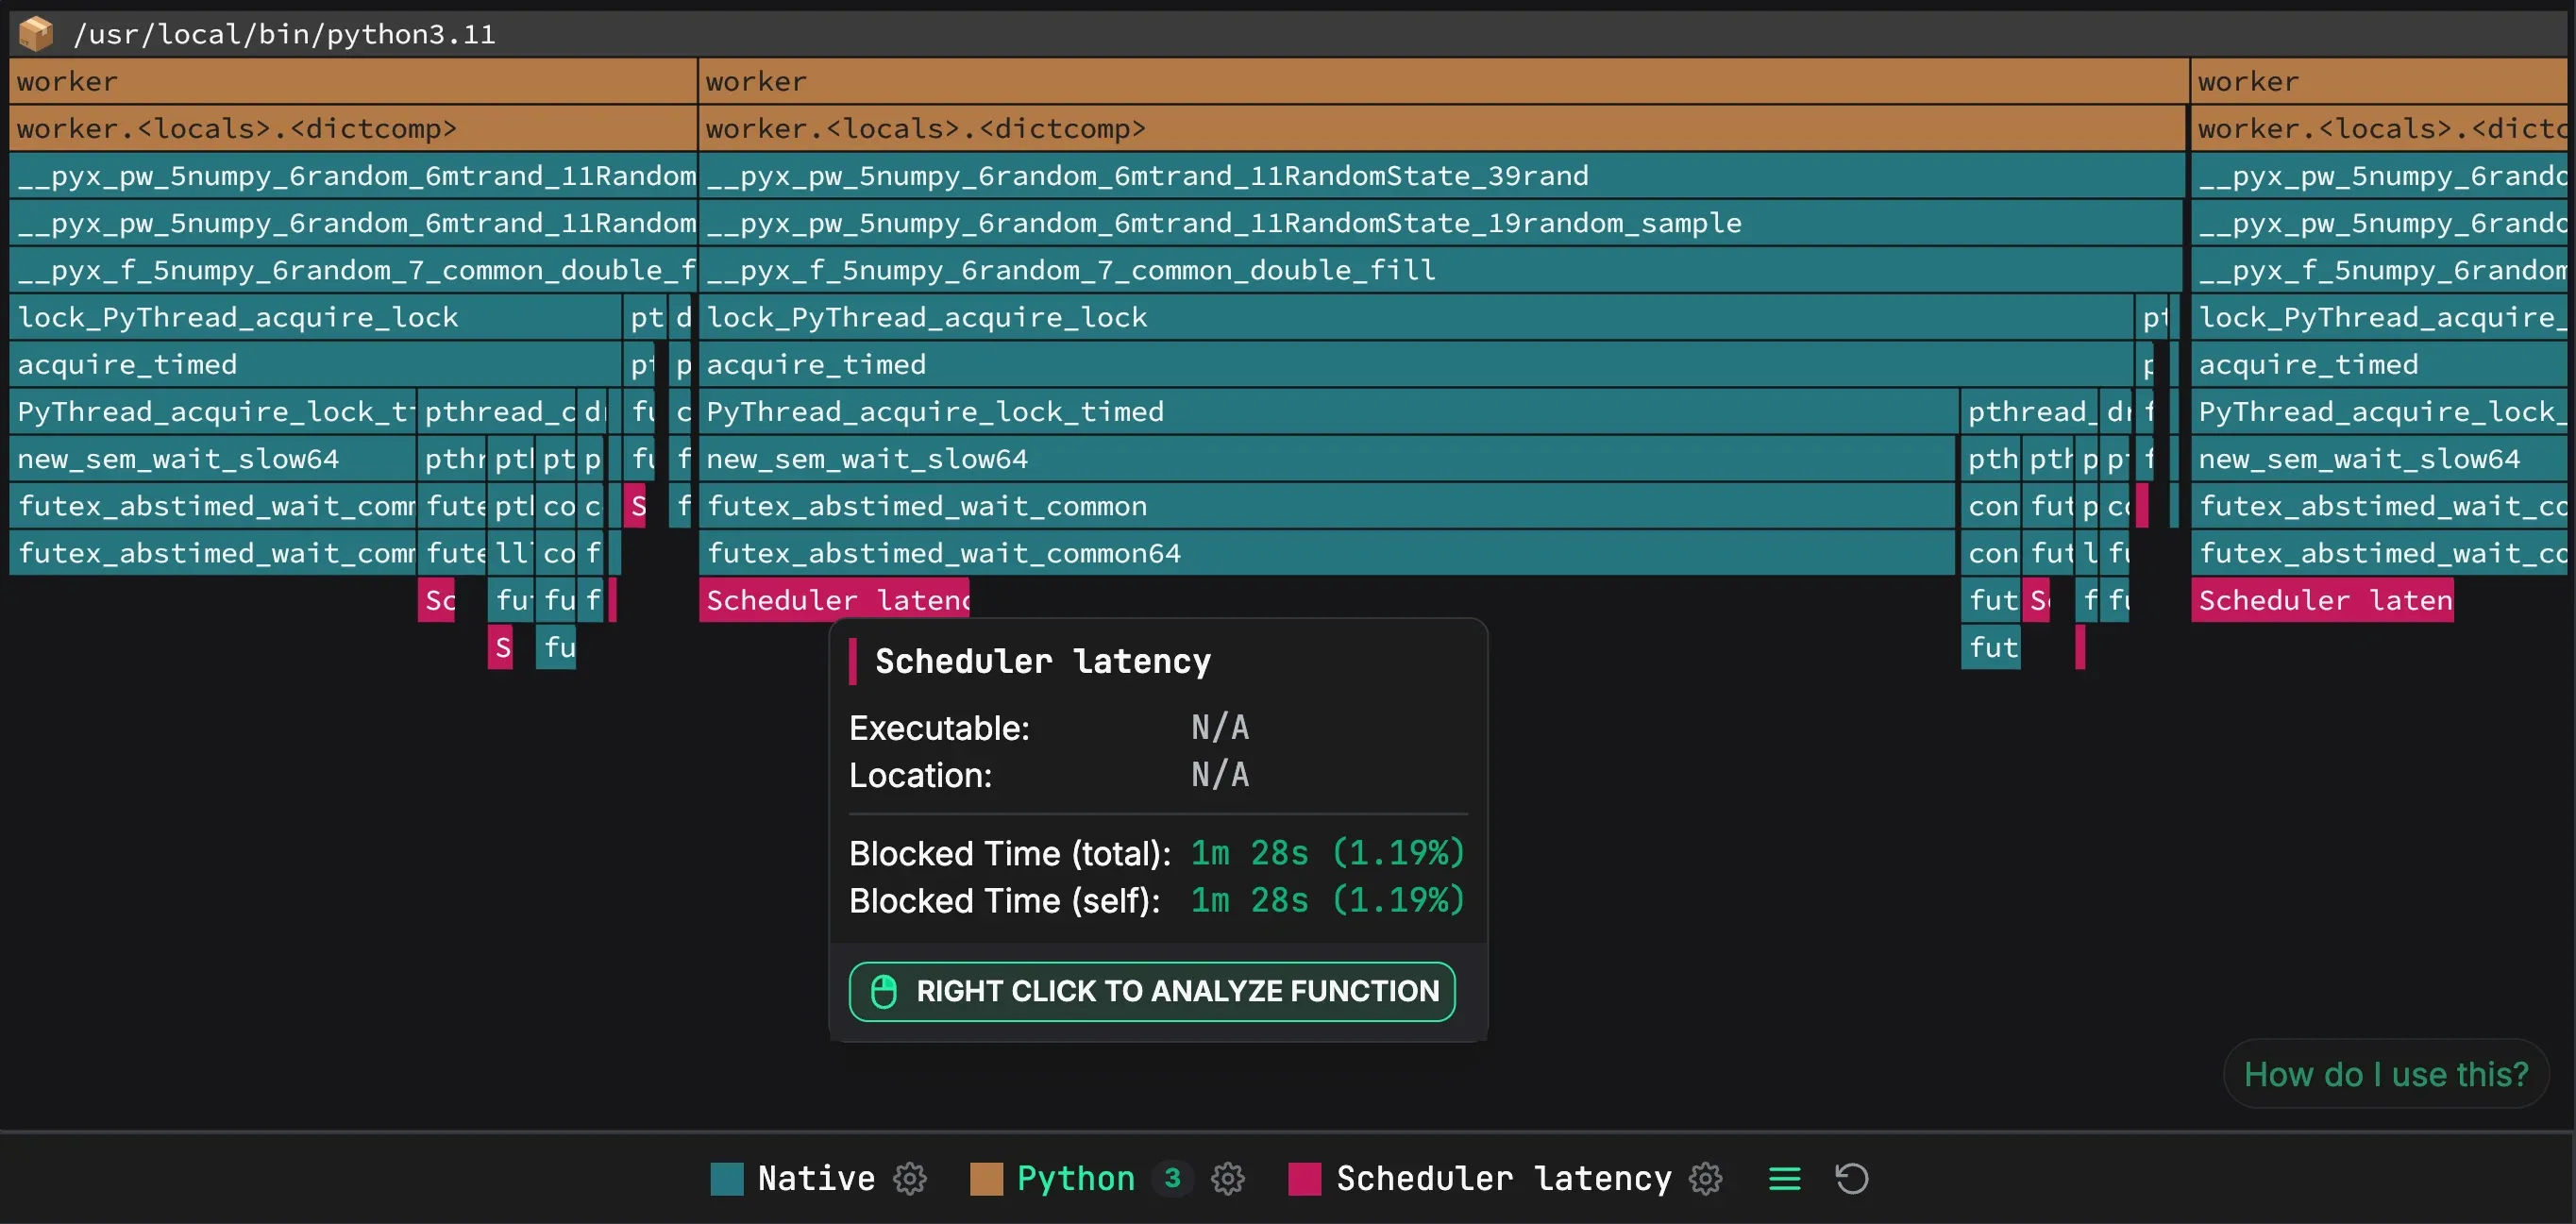
An off-CPU flamegraph of Python 3.11 worker threads blocked in lock_PyThread_acquire_lock, which waits through PyThread_acquire_lock_timed in futex calls, with scheduler latency frames under them. The hover card for scheduler latency shows 1m 28s of blocked time, 1.19% of the total.
Diff functions

Catch regressions with differential profiling

Compare two releases, containers or time ranges, and see which functions use more cores and which use fewer. The same diff works for NVIDIA and AMD GPU profiles.
  • Regressions in red and improvements in green, in cores and percent
  • A function that got slower stays visible even when the total got faster
  • A trend per function shows a steady shift or a few spikes
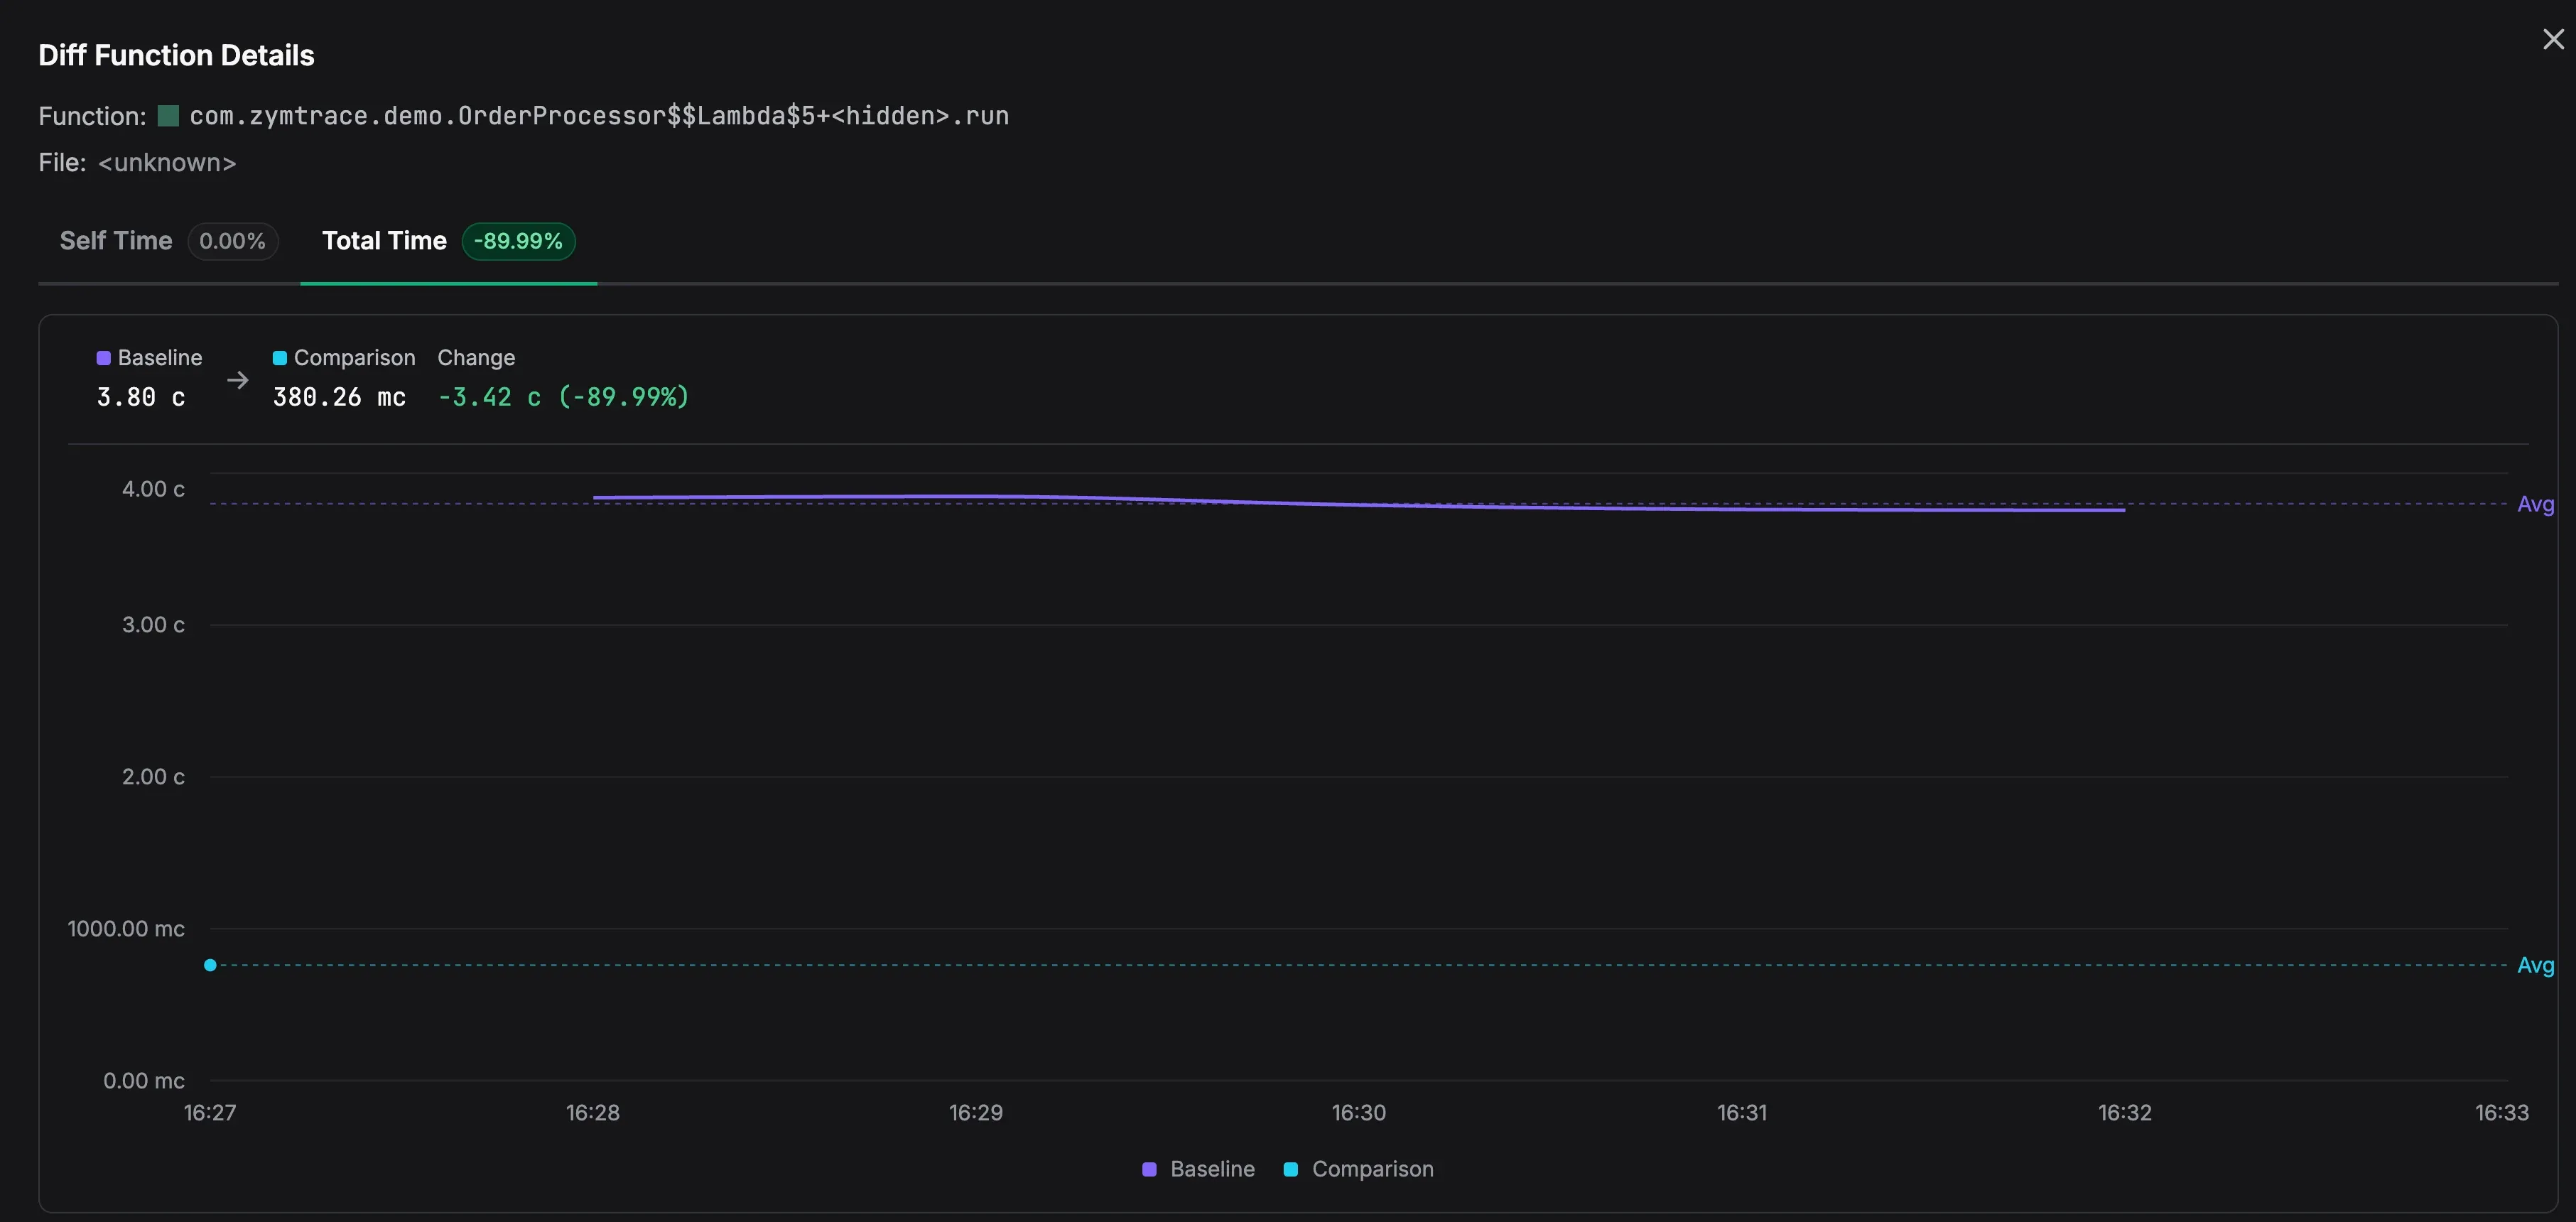
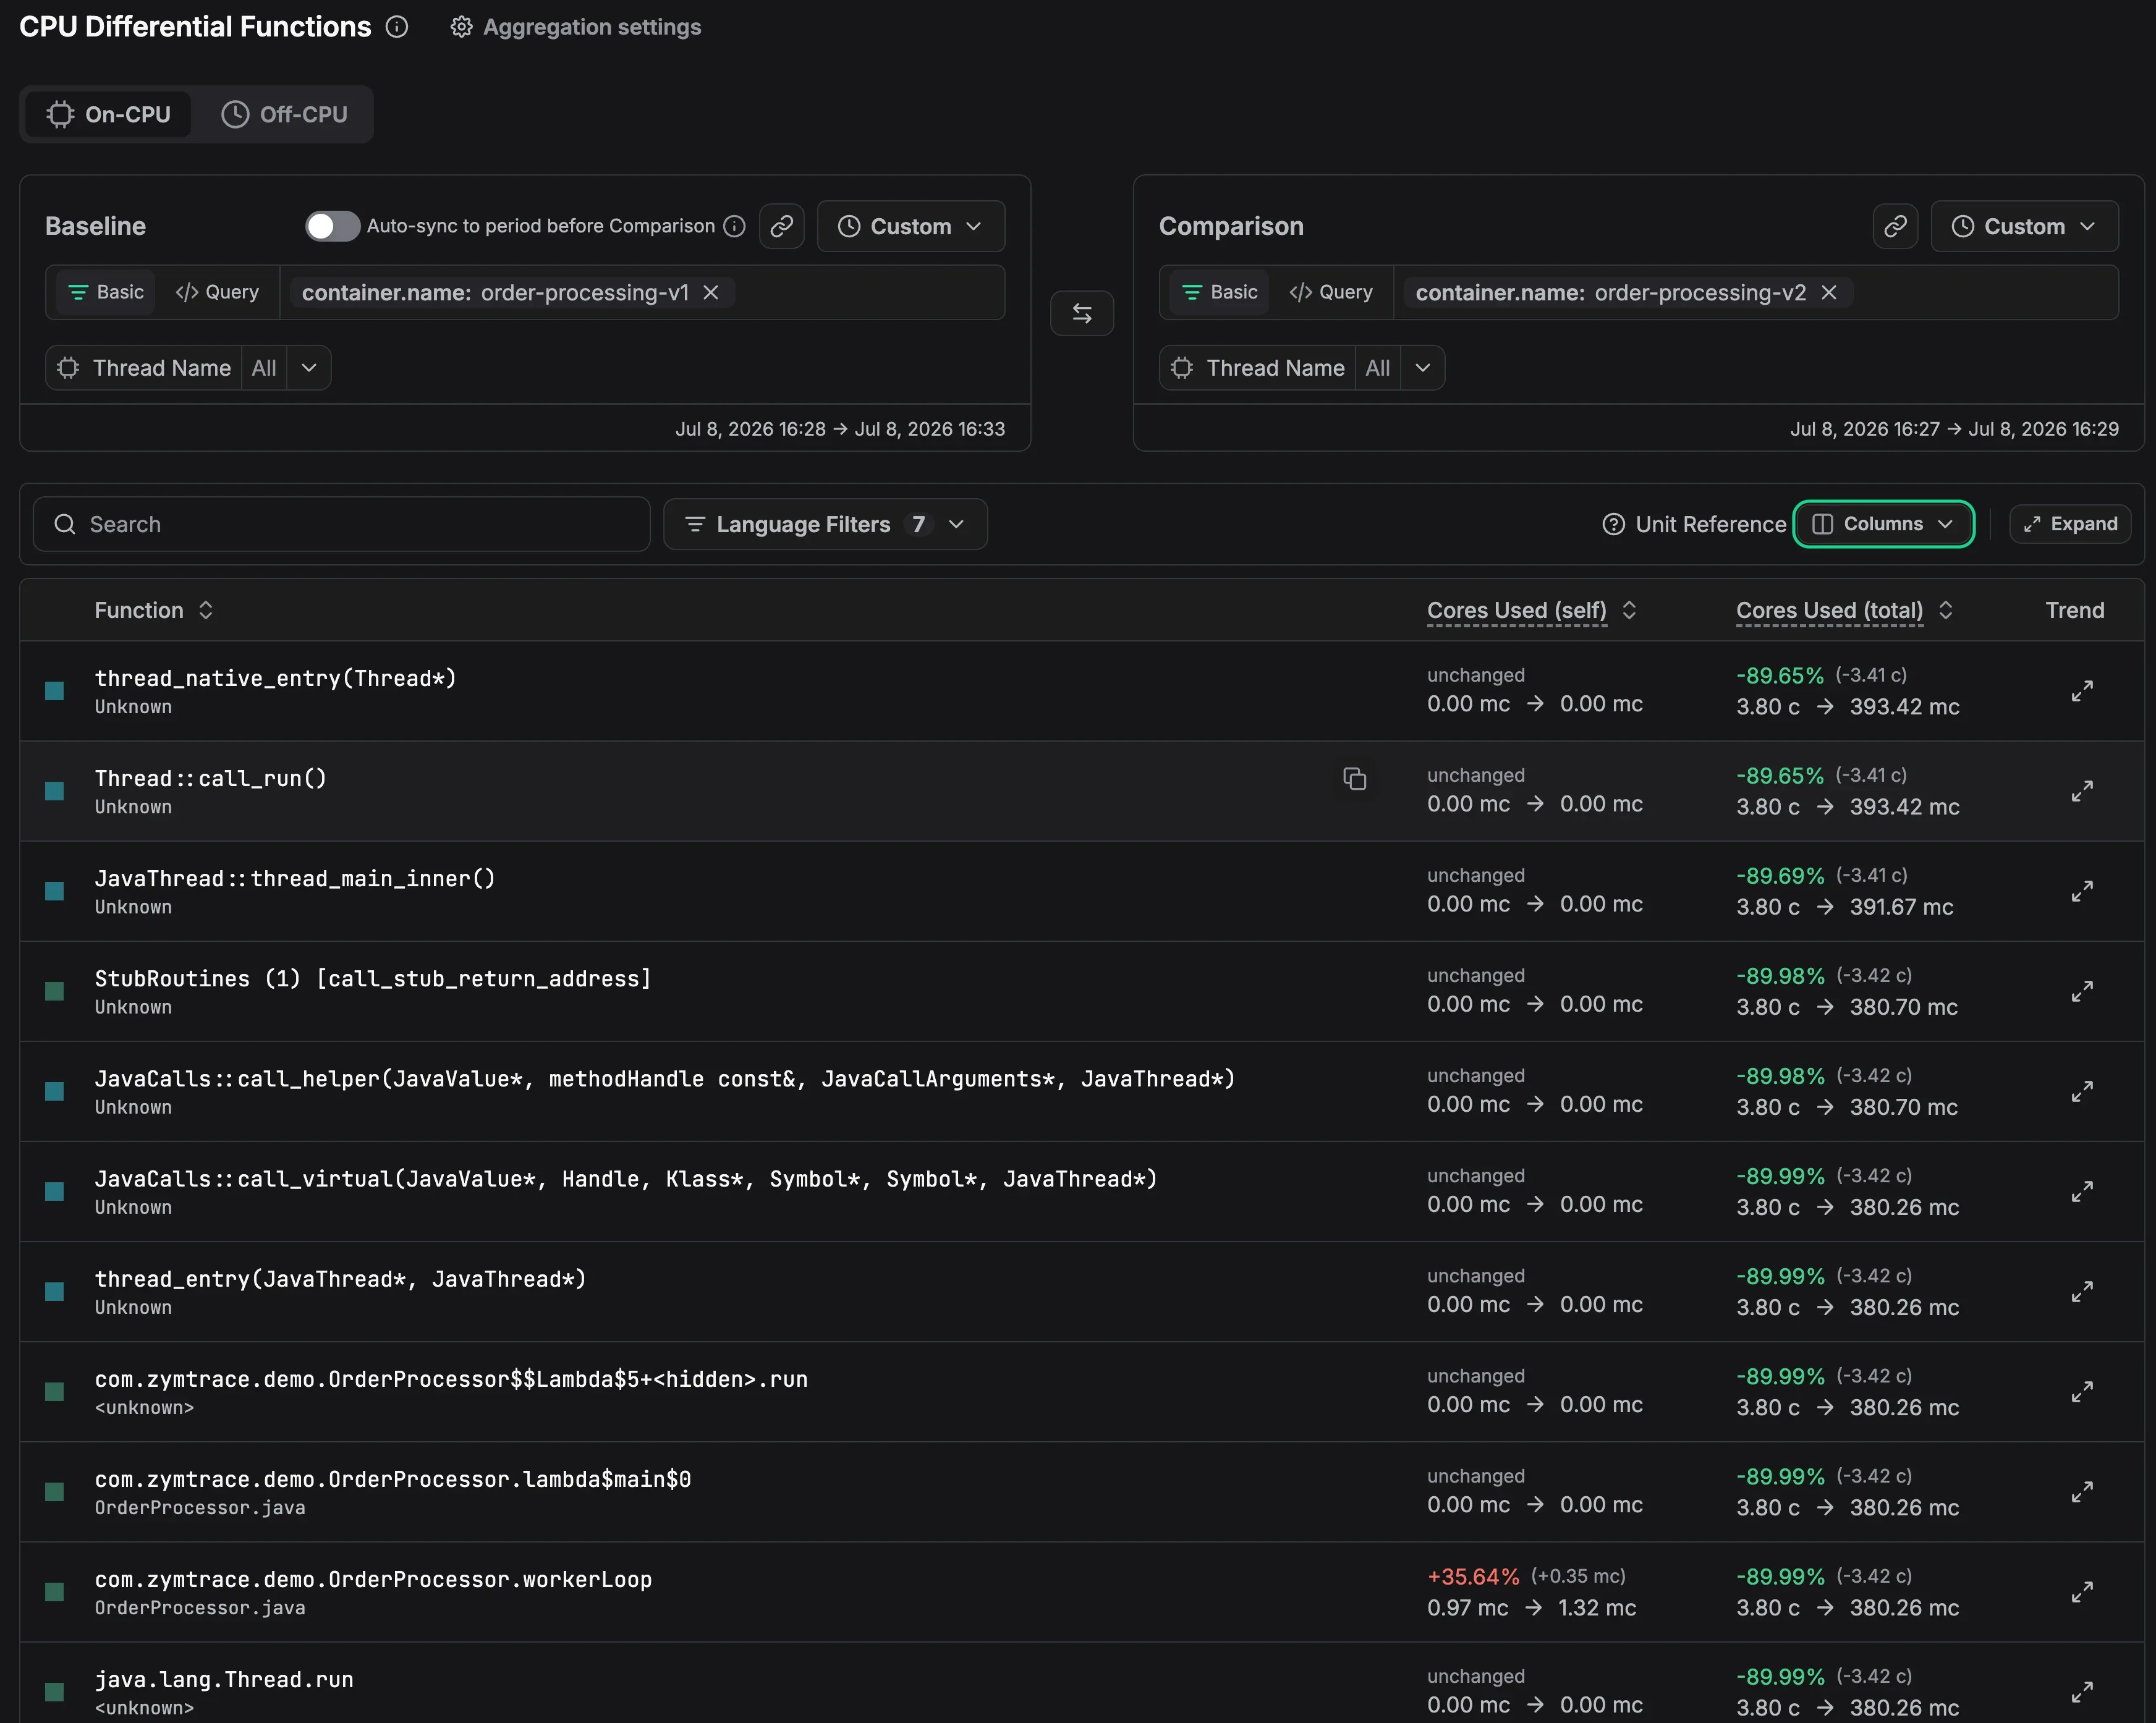
CPU Differential Functions comparing two containers, order-processing-v1 as the baseline and order-processing-v2 as the comparison. Each function's change in cores used, self and total, shows in percent and in cores. The JVM frames drop about 90% in total, 3.80 cores down to about 380 millicores, while the self time of OrderProcessor.workerLoop rises 35.64%, in red. Expanding a row opens its trend over time, here 3.80 cores in the baseline against 380.26 millicores in the comparison.
Coverage

Native, interpreted and kernel code

01

No frame pointers needed

Stacks unwind through C, C++ and Rust binaries built without frame pointers, with no debug symbols on the host.

02

Kernel included

Kernel frames sit under the user code, so syscalls, page faults and scheduling show up where they happen.

03

From the eBPF profiler's creators

Zymtrace's founders created the eBPF profiler they open-sourced and donated to OpenTelemetry.

FAQ

CPU profiling FAQ

A CPU profiler samples where threads spend CPU time. Continuous profiling does it all the time across the whole fleet, 19 times per second per core by default, so the data is already there when an issue happens and any two periods can be compared.
The profiler uses at most 1% CPU in our testing, typically much less, and about 256 MB of RAM, a little more with Java workloads, so it can run 24/7. The profiler profiles itself, so you can see its overhead.
Python 3.6+, Java 7+ including Azul Zing, Go, Rust, Zig, C and C++, Node.js, Ruby 2.5+, PHP 7.3+, .NET 7+ and Perl 5.28+. See the full list.
Linux 5.10 or later with BTF, on x86_64 or Arm64. The agent runs with CAP_SYS_ADMIN, as a Kubernetes DaemonSet, a container or a binary.

Profile your whole fleet

Zymtrace is fully self-hosted. 5 minutes is all you need to get it up and running.