Model-aware GPU profiling

Pinpoint what's slowing down your model

GPU kernels reveal where time is spent, but not which model operations are responsible. Zymtrace connects GPU execution to PyTorch layers and tensor shapes, so you can pinpoint costly operations and prioritize optimizations that improve model performance.

  • PyTorch
  • No annotations
  • vLLM parallel layout
Layer attribution

Kernels attributed to model layers

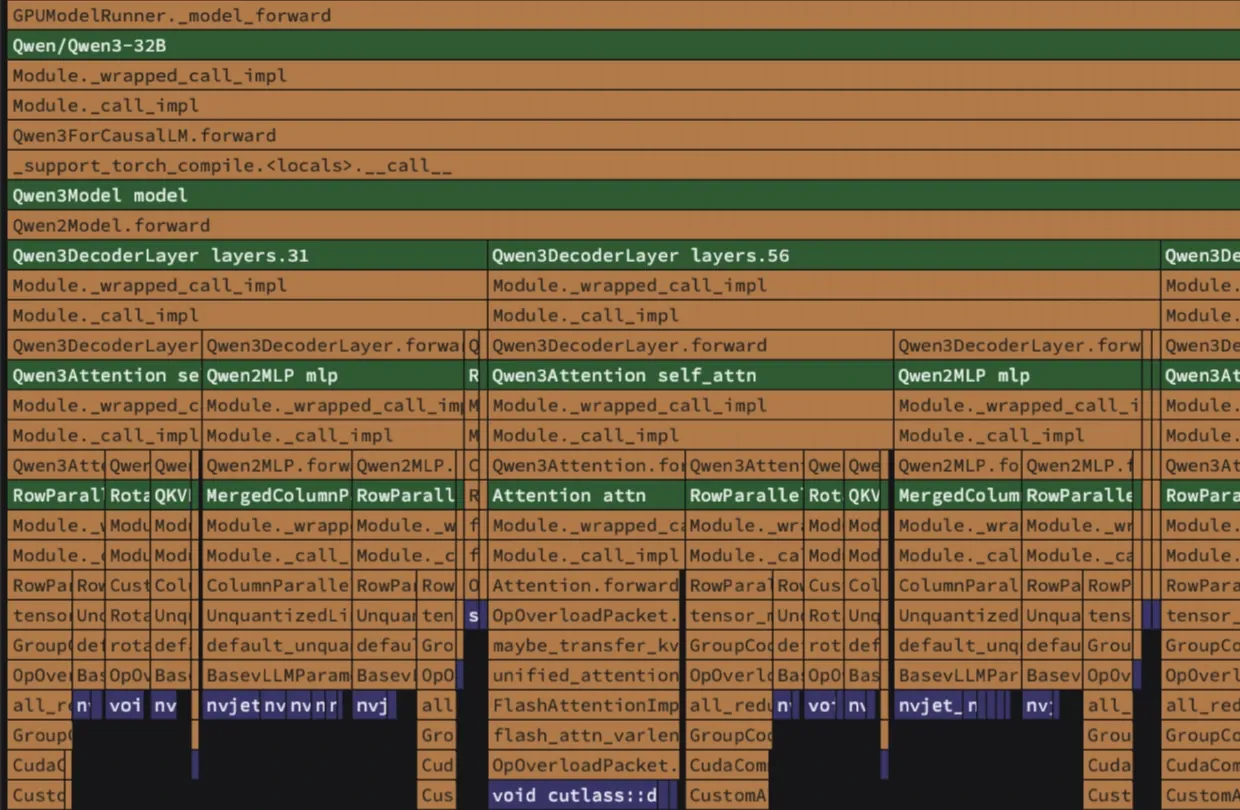
Model Layer frames sit between your Python code and the native stack, so a GEMM kernel reads as the layer that launched it.

  • Nothing runs on the forward path
  • Each layer is its own frame, so layers.17 and layers.18 compare side by side
  • Modules and flamegraph frames link to each other
A CUDA flamegraph of vLLM serving Qwen3-32B. Green Model Layer frames for Qwen/Qwen3-32B, Qwen3Model model and the decoder layers layers.31 and layers.56 sit between the Python frames, with Qwen3Attention self_attn and Qwen2MLP mlp inside each layer and the projection and attention modules directly above their nvjet GEMM and cutlass attention kernels.
Fleet inventory

Know which models are running on your GPUs

See the models loaded across your fleet, with their size, how they're sharded across GPUs, and the hosts and processes that run them.

  • Tensor- and pipeline-parallel layout of vLLM deployments
  • Hosts, machines and processes for each model
  • Filter by Kubernetes namespace, deployment or Slurm job
What you get

The model's structure, read from the running process

01

Module tree

Modules tinted by role, with repeated layers folded.

02

Tensor shapes and dtypes

Each module's tensors, plus a precision breakdown for the model.

03

Parallel layout

vLLM's tensor- and pipeline-parallel layout, with logical shapes per shard.

04

No annotations

No NVTX ranges, no code changes. Read every 30 seconds by default.

05

NVIDIA and AMD

Turn it on with ZYMTRACE_CUDAPROFILER__MODEL_SHAPE__ENABLED=true or the ROCm equivalent.

06

Known limits

CUDA graphs flatten nesting, so serve vLLM with --enforce-eager for full depth.

FAQ

Model shapes FAQ

Set ZYMTRACE_CUDAPROFILER__MODEL_SHAPE__ENABLED=true, or ZYMTRACE_ROCMPROFILER__MODEL_SHAPE__ENABLED=true on AMD, and turn on Models in Settings.
No. Nothing runs on the forward path, the measured overhead stays within run-to-run noise, and the profiler uses about 25 MB of fixed memory for it.
PyTorch, including models served by vLLM. The parallel layout comes from vLLM's configuration; other launchers report one rank's shape.
NVTX ranges have to be added to the code or the framework. Model shapes are read from the running process, with no annotations.

See your models in the profile

Zymtrace is fully self-hosted. 5 minutes is all you need to get it up and running.