NCCL 2.27 or newer
Reads NCCL's own metrics, with no change to your code.
One late GPU makes every other GPU wait. Zymtrace finds it, shows why, and correlates it to the corresponding GPU profiles.
Zymtrace compares the late GPU's clock with its peers', checks its throttle reasons, such as a power cap, and looks for NVLink errors.
Zymtrace tracks each collective's bandwidth per communicator and message size, and flags drops of 30% or more from its recent normal.
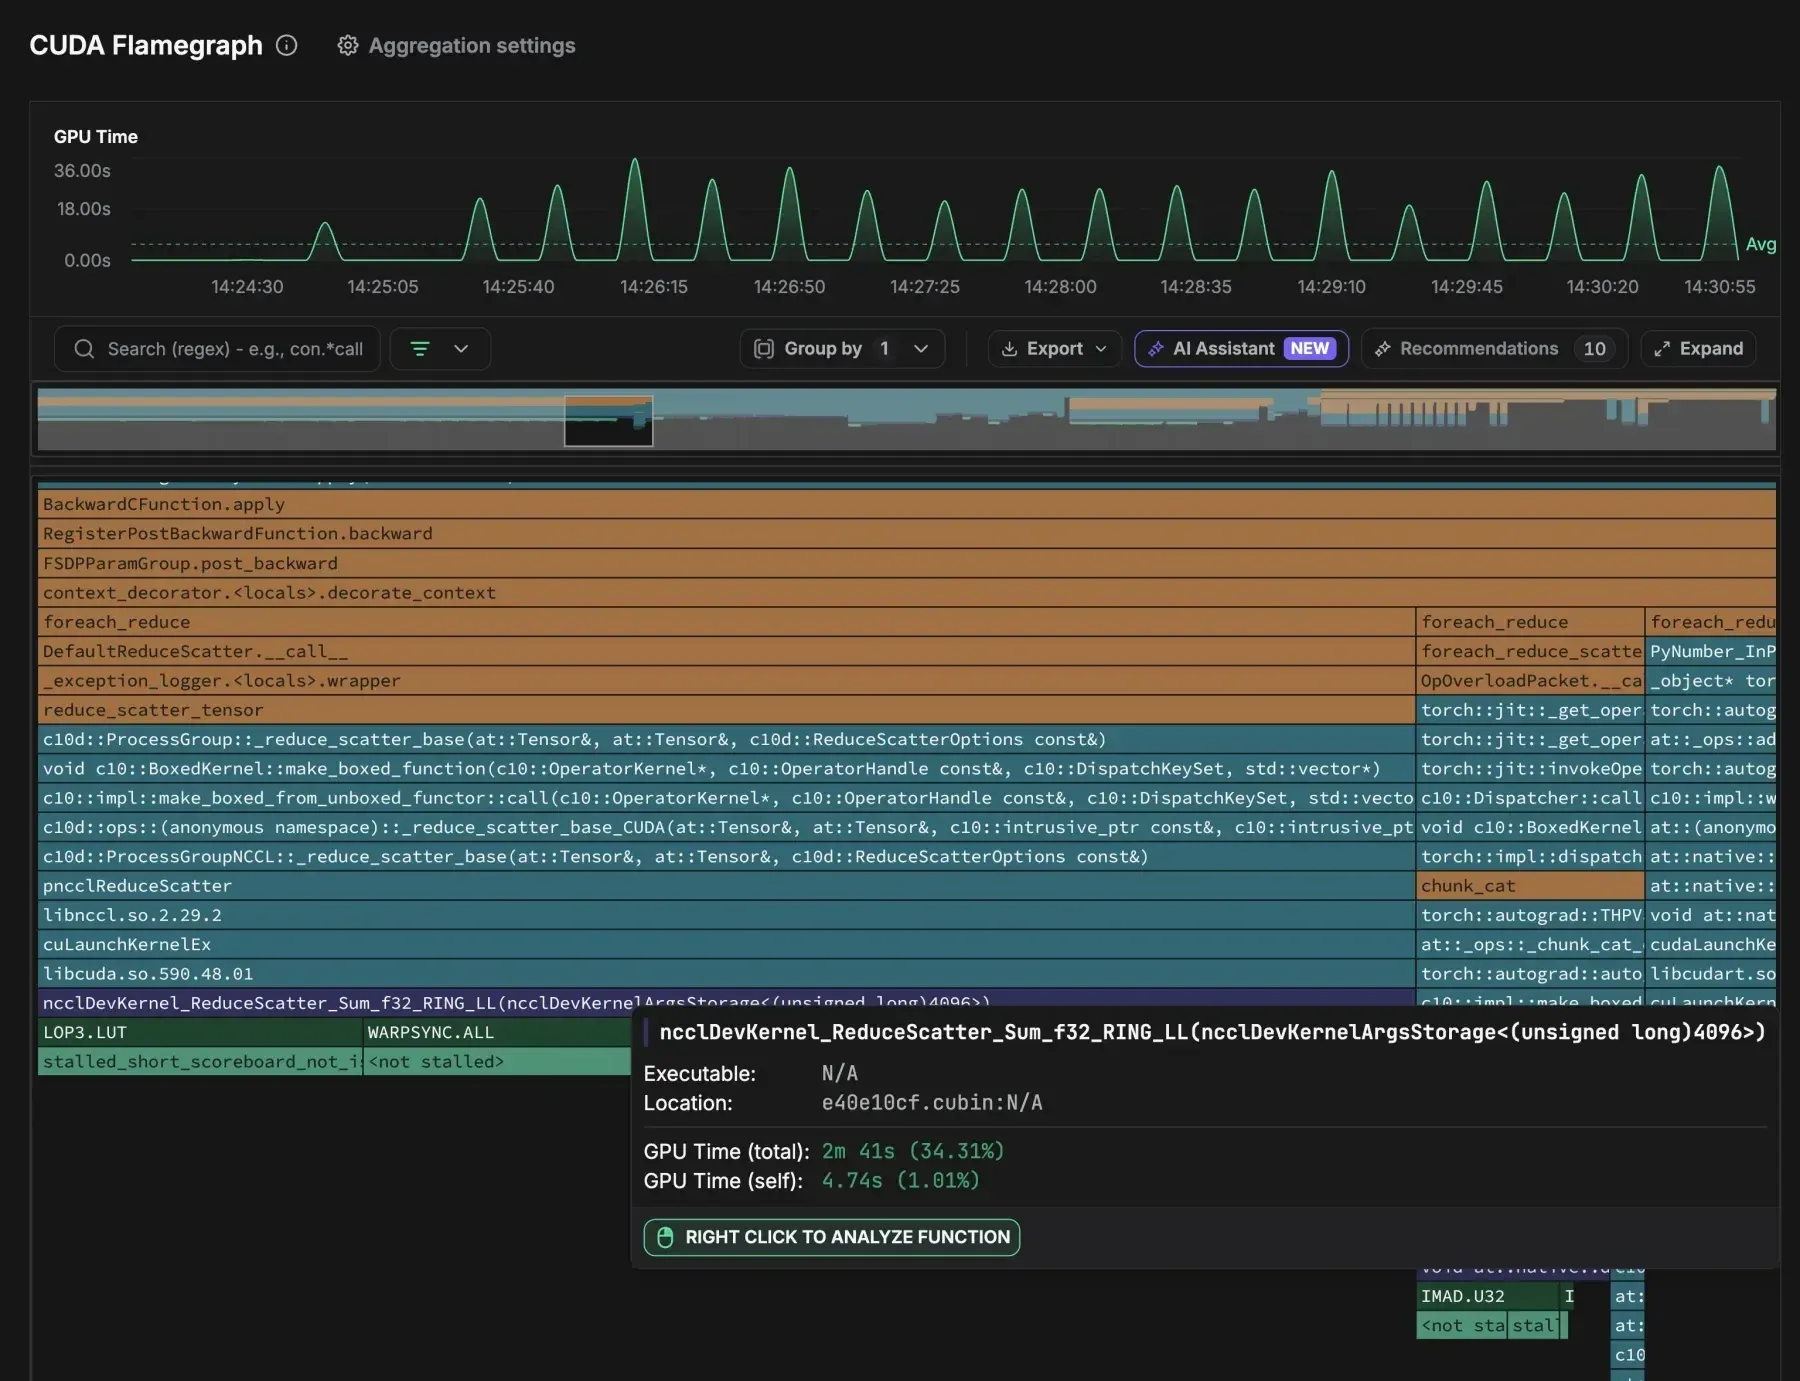
Detection runs on the profiler's own data, so each straggler opens the CUDA flamegraph of its GPU and window, down to the NCCL kernel that waits.
In ByteDance's OSDI '25 study, stragglers slowed 42.5% of traced jobs and wasted 10.4% of all allocated GPU hours.
Reads NCCL's own metrics, with no change to your code.
Set ZYMTRACE_CUDAPROFILER__NCCL=true, or turn it on in a CUDA profiler rule.
AllReduce, AllGather, ReduceScatter and more, per communicator and message size.
Clock against its peers', throttle reasons such as power caps, and NVLink errors.
Scope stragglers and slow operations to a Slurm job, a host or a communicator.
MCP tools for stragglers, slow collectives and their causes.
ZYMTRACE_CUDAPROFILER__NCCL=true on every process of the job, or NCCL collection in a CUDA profiler rule. The launch post walks through a full investigation.Zymtrace is fully self-hosted. 5 minutes is all you need to get it up and running.