NVIDIA GPU profiling

Squeeze more FLOPs from your NVIDIA GPUs

GPU stalls don't tell you which application code caused them. Zymtrace connects kernels to their Python and native stacks, down to SASS instructions and stall reasons, so engineers and AI agents know where to focus their fixes.
  • Always on
  • Fleet-wide
  • No code changes
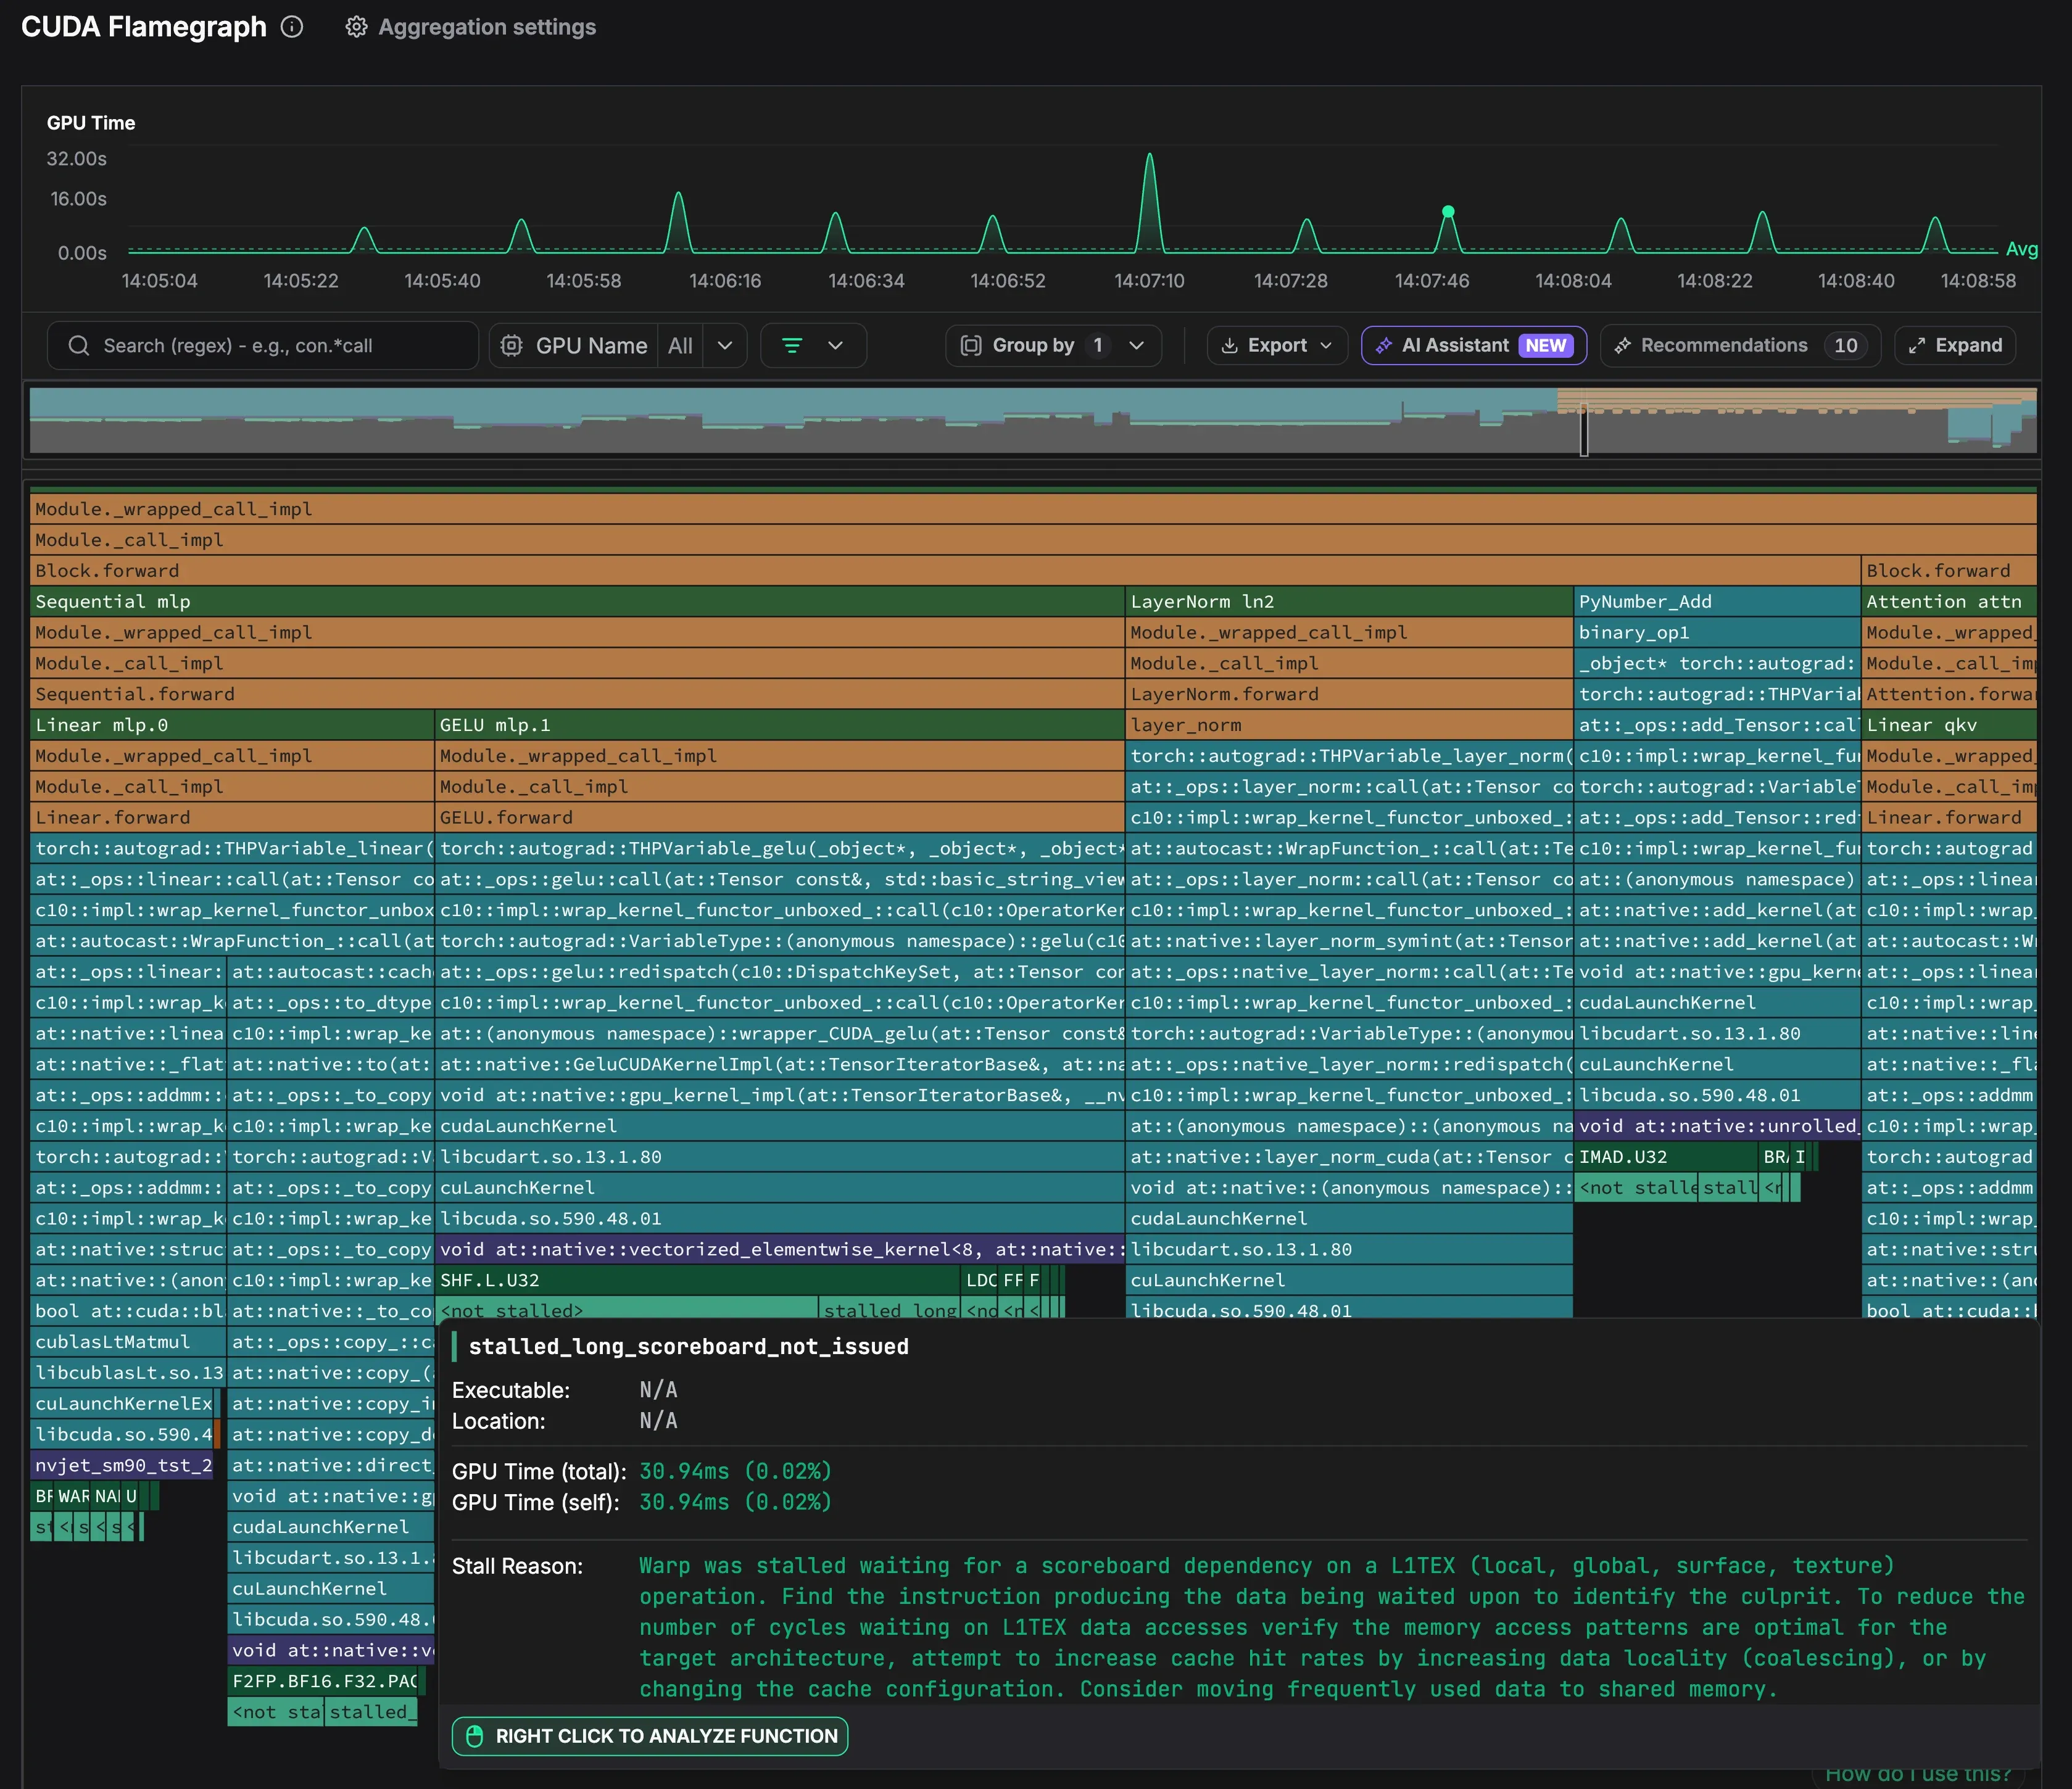
A CUDA flamegraph of a GPT training step: Python and model-layer frames such as Block.forward, Sequential mlp, Linear mlp.0, GELU mlp.1, LayerNorm ln2 and Attention attn, above the PyTorch and CUDA runtime frames, the kernels, their SASS instructions and stall reasons. A tooltip on stalled_long_scoreboard_not_issued shows 30.94 ms of GPU time and NVIDIA's explanation: the warp was stalled waiting for a scoreboard dependency on an L1TEX operation.
Stall reasons

CUDA stall reasons down to the SASS instruction

PC sampling records which SASS instruction a warp was on and why it stalled, and ties the samples to their kernel and launch stack.

  • Per instruction, per kernel and per host
  • CUDA graphs included
  • Opt-in, with profiling permission on the host
Metrics and profiles

See the code behind any GPU metric

Click any point on any NVIDIA GPU chart to open the CUDA flamegraph of that moment.

  • Utilization, memory, power, clocks and throttling
  • SM occupancy and Tensor Core utilization
  • Per process, per GPU and per MIG instance
GPU timeline

A GPU timeline of kernels, copies and syncs

Kernels, memory copies and syncs with nanosecond timestamps and their CPU launch stacks, for when an average hides the problem.
  • NVTX ranges and syncs on their own rows
  • Up to one million events per view
  • Cut a sentence-transformers run 6.9×, to 82 s
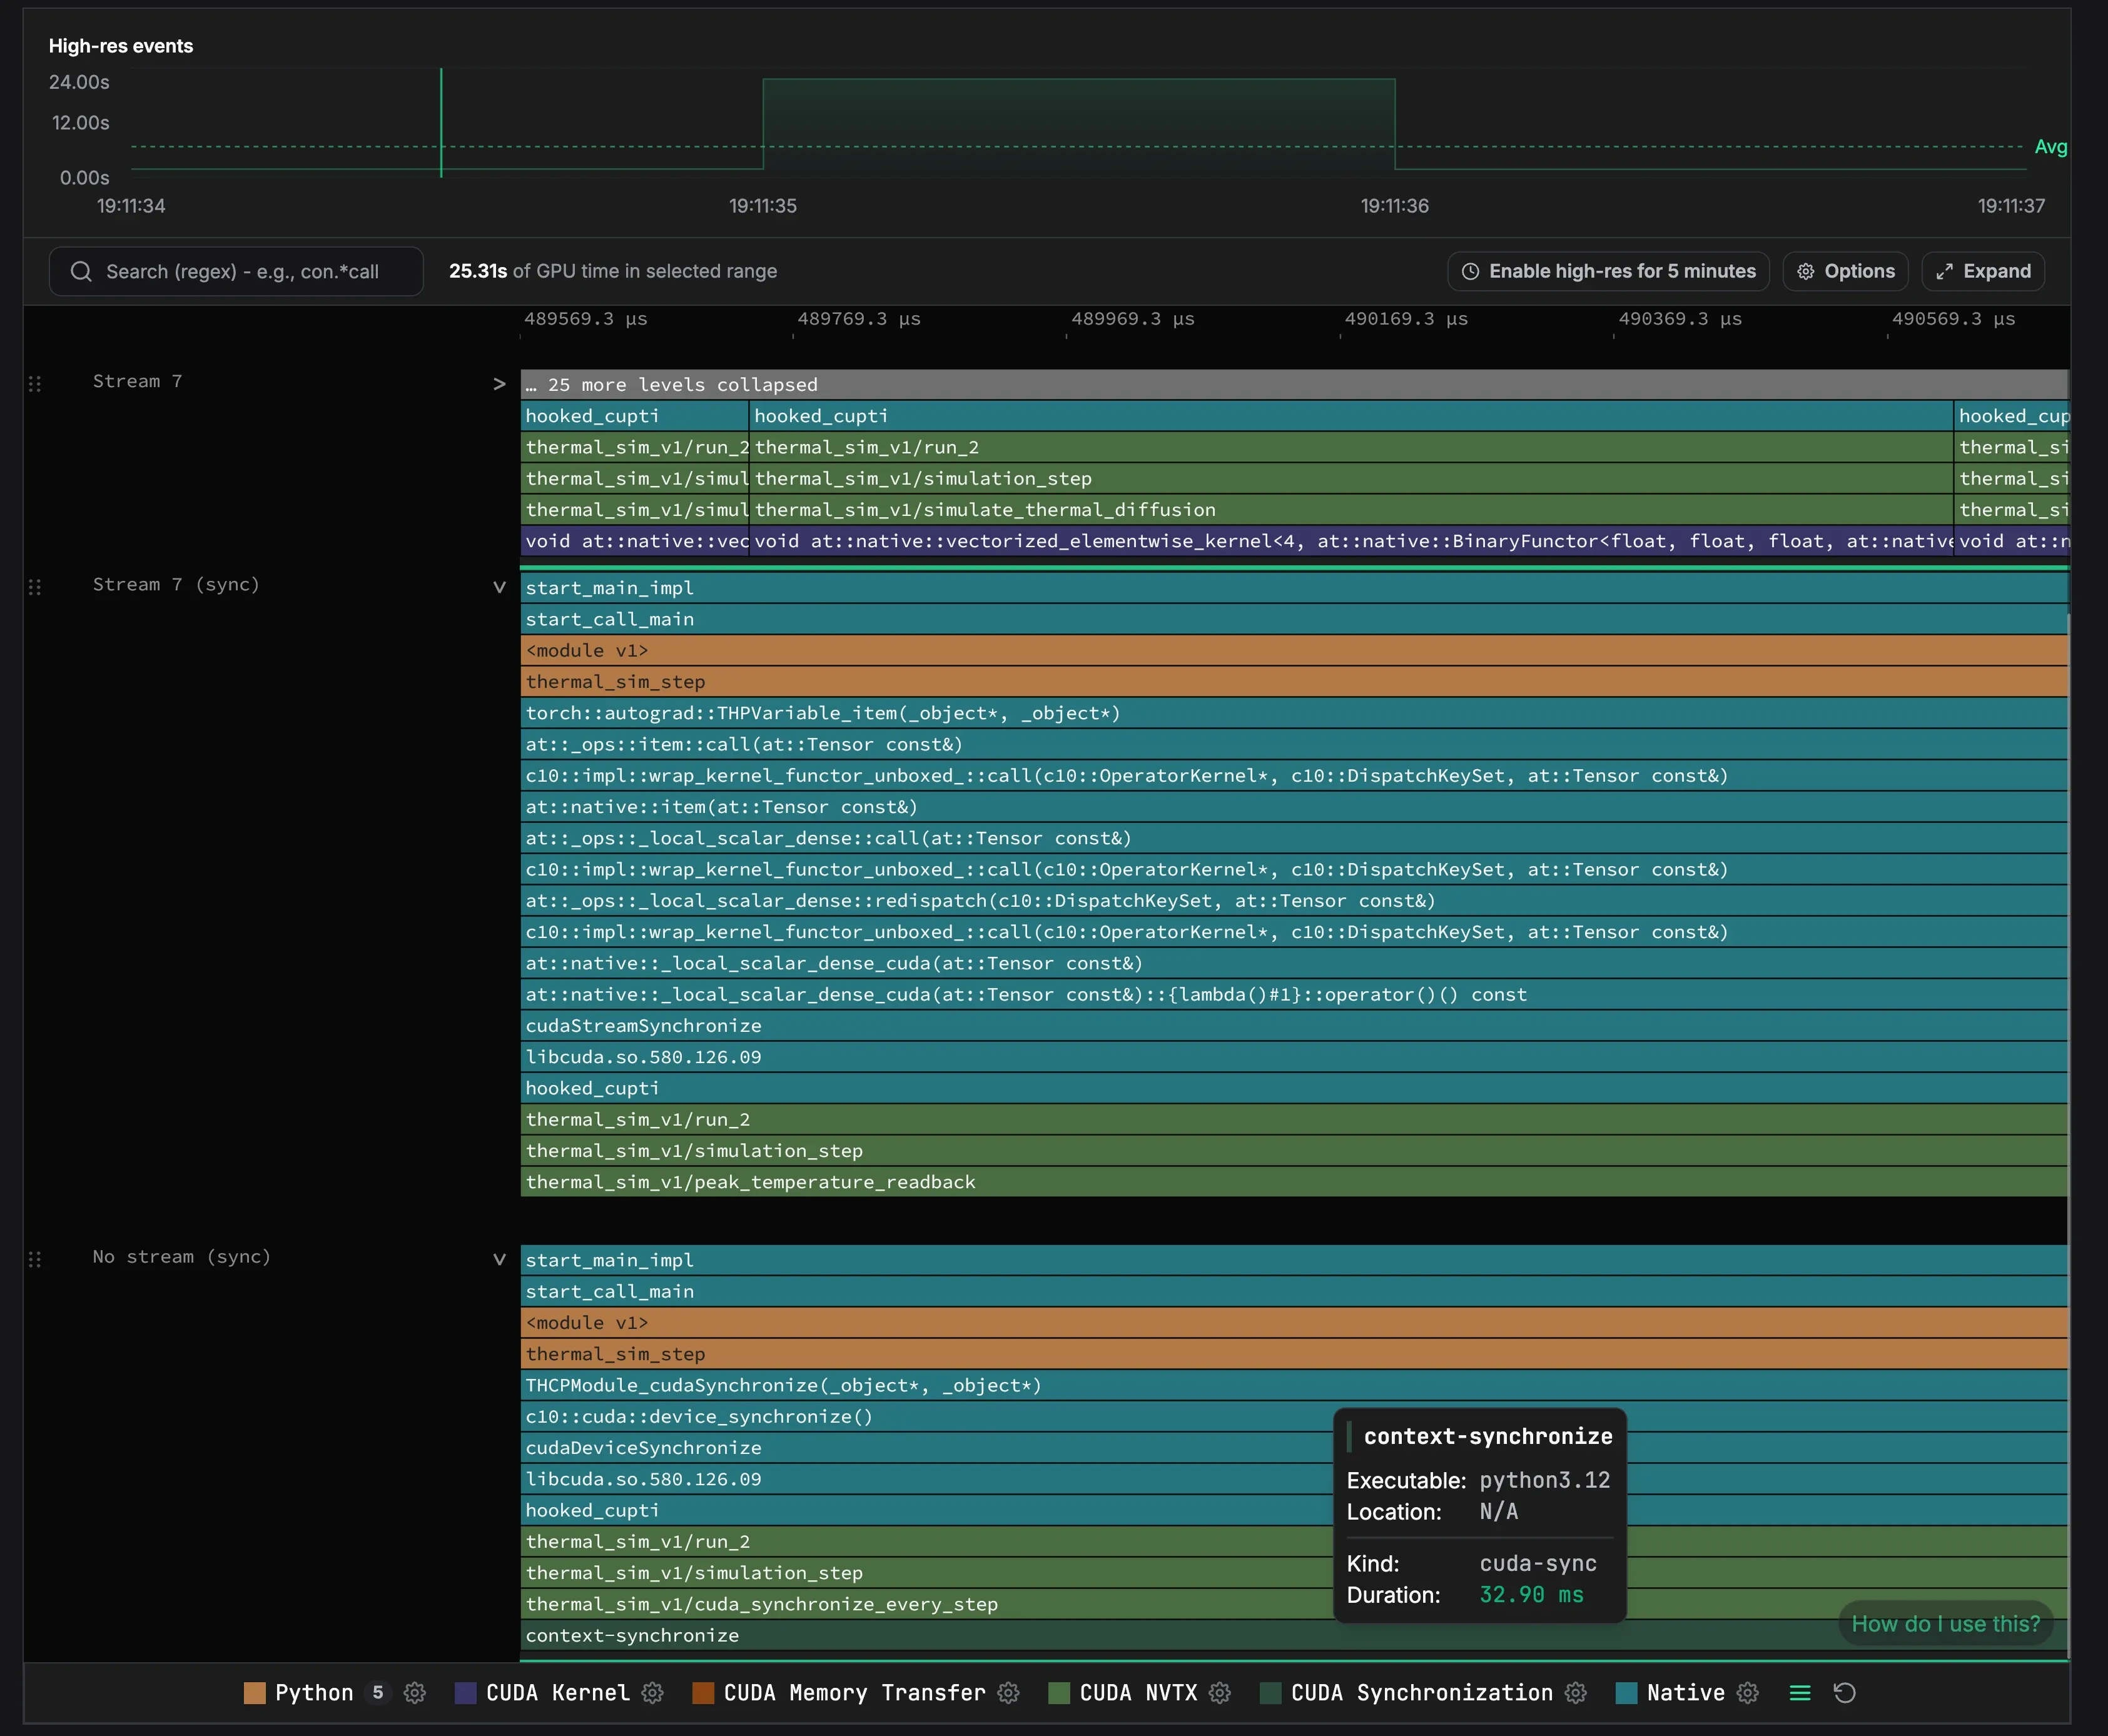
The CUDA timeline of a thermal simulation in python3.12. On stream 7, the NVTX ranges thermal_sim_v1/run_2, simulation_step and simulate_thermal_diffusion sit above a vectorized elementwise kernel. The stream 7 sync lane shows peak_temperature_readback waiting in cudaStreamSynchronize, and the device-wide sync lane shows cuda_synchronize_every_step, with a tooltip on a 32.90 ms context-synchronize.
Built for GPU clusters

Profiling that scales with the cluster

01

MIG-aware

Metrics and flamegraphs for each MIG instance, detected automatically.

02

NVTX in the flamegraph

NVTX ranges show up as frames above the kernels they wrap.

03

Multi-GPU and multi-node

One agent per node, one backend, no extra flags.

04

Slurm-aware

Samples carry their Slurm job ID, name and user.

05

No restarts

Turn profiling on per workload from the UI with agent rules.

06

Kernels on model layers

With model shapes, each kernel shows the PyTorch layer that launched it.

FAQ

NVIDIA GPU profiling FAQ

Nsight profiles one run on one machine, and Nsight Compute's kernel replay adds 20–200× overhead. Zymtrace profiles continuously across the whole cluster in production. Read the full comparison.
An eBPF profiler records CPU stacks, and a CUDA profiling library records kernel launches and GPU instruction samples. Zymtrace joins each kernel's samples to the CPU stack that launched it.
Any NVIDIA GPU with CUDA 12 or later on x86_64 and Arm64, including Blackwell (B200, B300, RTX PRO 6000), Grace Blackwell (GB200, GB300), Hopper (H100, H200), Grace Hopper (GH200), Ada Lovelace (L4, L40S), Ampere (A100, A10G), Turing (T4) and Volta (V100).
No. Agent rules in the UI inject the profiler into the workloads you pick, or you can start a process with CUDA_INJECTION64_PATH pointing at the profiler library.
Yes. Zymtrace is fully self-hosted, symbolization included, so no data leaves your infrastructure.

Profile your GPUs in production

Zymtrace is fully self-hosted. 5 minutes is all you need to get it up and running.